

THE NEAR-SURFACE LAYER OF THE OCEAN
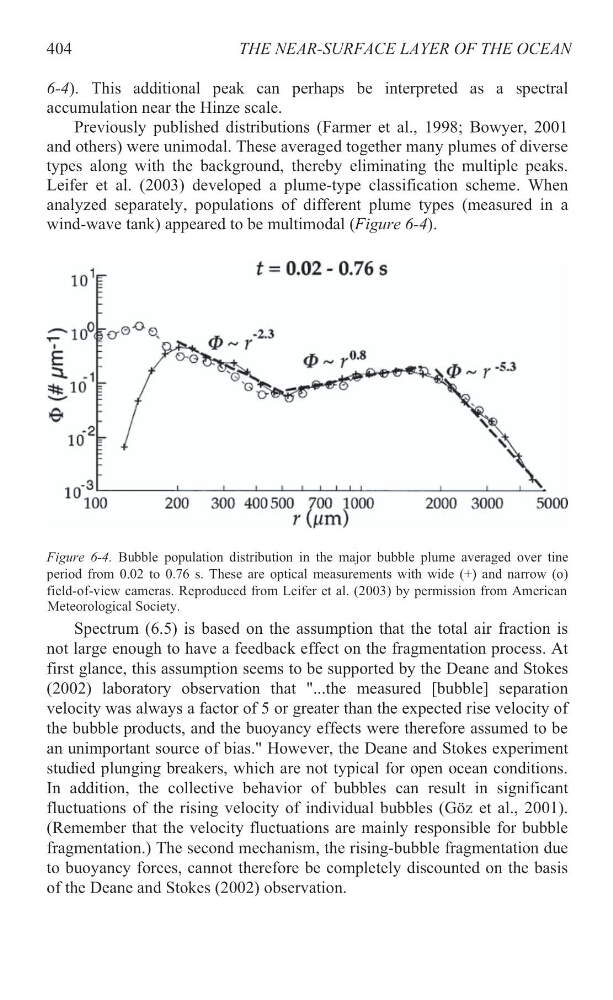
6-4). This additional peak can perhaps be interpreted as a spectral
accumulation near the Hinze scale.
Previously published distributions (Farmer et al., 1998; Bowyer, 2001
and others) were unimodal. These averaged together many plumes of diverse
types along with the background, thereby eliminating the multiple peaks.
Leifer et al. (2003) developed a plume-type classification scheme. When
analyzed separately, populations of different plume types (measured in a
wind-wave tank) appeared to be multimodal (Figure 6-4).
Figure 6-4. Bubble population distribution in the major bubble plume averaged over tine
period from 0.02 to 0.76 s. These are optical measurements with wide (+) and narrow (o)
Spectrum (6.5) is based on the assumption that the total air fraction is
not large enough to have a feedback effect on the fragmentation process. At
first glance, this assumption seems to be supported by the Deane and Stokes
(2002) laboratory observation that "...the measured [bubble] separation
velocity was always a factor of 5 or greater than the expected rise velocity of
the bubble products, and the buoyancy effects were therefore assumed to be
an unimportant source of bias." However, the Deane and Stokes experiment
studied plunging breakers, which are not typical for open ocean conditions.
In addition, the collective behavior of bubbles can result in significant
fluctuations of the rising velocity of individual bubbles (Göz et al., 2001).
fragmentation.) The second mechanism, the rising-bubble fragmentation due
to buoyancy forces, cannot therefore be completely discounted on the basis
of the Deane and Stokes (2002) observation.
404
Meteorological Society.
(Remember that the velocity fluctuations are mainly responsible for bubble
field-of-view cameras. Reproduced from Leifer et al. (2003) by permission from American
6-4). This additional peak can perhaps be interpreted as a spectral
accumulation near the Hinze scale.
Previously published distributions (Farmer et al., 1998; Bowyer, 2001
and others) were unimodal. These averaged together many plumes of diverse
types along with the background, thereby eliminating the multiple peaks.
Leifer et al. (2003) developed a plume-type classification scheme. When
analyzed separately, populations of different plume types (measured in a
wind-wave tank) appeared to be multimodal (Figure 6-4).
Figure 6-4. Bubble population distribution in the major bubble plume averaged over tine
period from 0.02 to 0.76 s. These are optical measurements with wide (+) and narrow (o)
Spectrum (6.5) is based on the assumption that the total air fraction is
not large enough to have a feedback effect on the fragmentation process. At
first glance, this assumption seems to be supported by the Deane and Stokes
(2002) laboratory observation that "...the measured [bubble] separation
velocity was always a factor of 5 or greater than the expected rise velocity of
the bubble products, and the buoyancy effects were therefore assumed to be
an unimportant source of bias." However, the Deane and Stokes experiment
studied plunging breakers, which are not typical for open ocean conditions.
In addition, the collective behavior of bubbles can result in significant
fluctuations of the rising velocity of individual bubbles (Göz et al., 2001).
fragmentation.) The second mechanism, the rising-bubble fragmentation due
to buoyancy forces, cannot therefore be completely discounted on the basis
of the Deane and Stokes (2002) observation.
404
Meteorological Society.
(Remember that the velocity fluctuations are mainly responsible for bubble
field-of-view cameras. Reproduced from Leifer et al. (2003) by permission from American