

THE NEAR-SURFACE LAYER OF THE OCEAN
used the deeper part of the experimental profile. (This constant would be
smaller if we used the near-surface part of the profile.)
Figure 3-18 shows the COARE data scaled according to the Terray et al.
(1996) variables z H s and HH s /F 0 . The CB94 model (3.44) with z 0
parameterized according to (3.47) and with the turbulence flux of the kinetic
energy expressed with (3.35) reads in dimensionless coordinates
0
/
S
H F
H
and
S
z H as follows:
2.4
1
0
1
3/(
) 1
/
/
/
w
q
T
S
S
T
S
BS
c
z H
H F
c
z H
D
H
N
ª
º
«
»
¬
¼
.
(3.52)
184
/
/
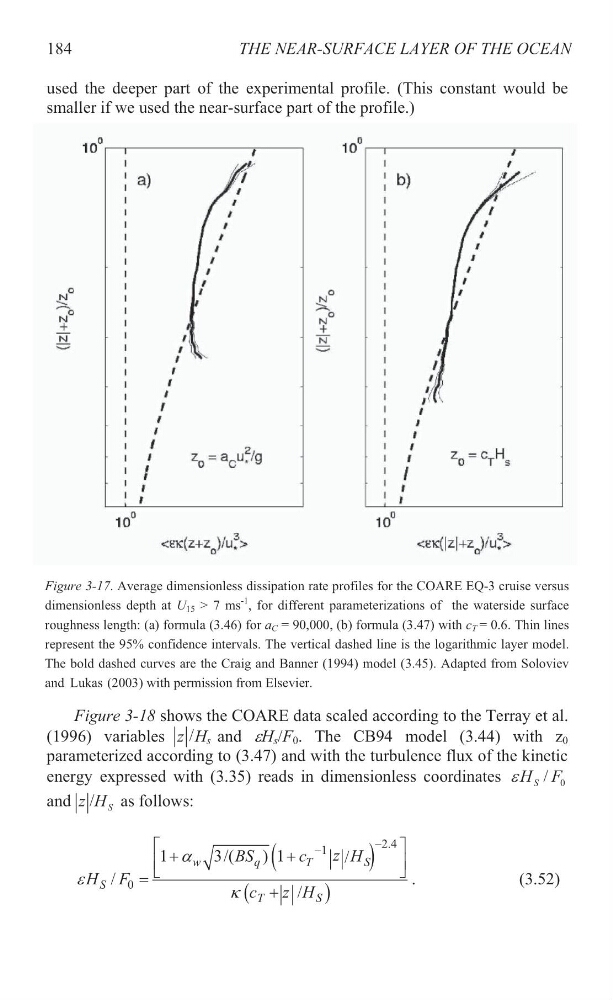
Figure 3-17. Average dimensionless dissipation rate profiles for the COARE EQ-3 cruise versus
dimensionless depth at U 15 > 7 ms
-1 , for different parameterizations of the waterside surface
roughness length: (a) formula (3.46) for a C = 90,000, (b) formula (3.47) with c T = 0.6. Thin lines
represent the 95% confidence intervals. The vertical dashed line is the logarithmic layer model.
The bold dashed curves are the Craig and Banner (1994) model (3.45). Adapted from Soloviev
and Lukas (2003) with permission from Elsevier.
used the deeper part of the experimental profile. (This constant would be
smaller if we used the near-surface part of the profile.)
Figure 3-18 shows the COARE data scaled according to the Terray et al.
(1996) variables z H s and HH s /F 0 . The CB94 model (3.44) with z 0
parameterized according to (3.47) and with the turbulence flux of the kinetic
energy expressed with (3.35) reads in dimensionless coordinates
0
/
S
H F
H
and
S
z H as follows:
2.4
1
0
1
3/(
) 1
/
/
/
w
q
T
S
S
T
S
BS
c
z H
H F
c
z H
D
H
N
ª
º
«
»
¬
¼
.
(3.52)
184
/
/
Figure 3-17. Average dimensionless dissipation rate profiles for the COARE EQ-3 cruise versus
dimensionless depth at U 15 > 7 ms
-1 , for different parameterizations of the waterside surface
roughness length: (a) formula (3.46) for a C = 90,000, (b) formula (3.47) with c T = 0.6. Thin lines
represent the 95% confidence intervals. The vertical dashed line is the logarithmic layer model.
The bold dashed curves are the Craig and Banner (1994) model (3.45). Adapted from Soloviev
and Lukas (2003) with permission from Elsevier.