

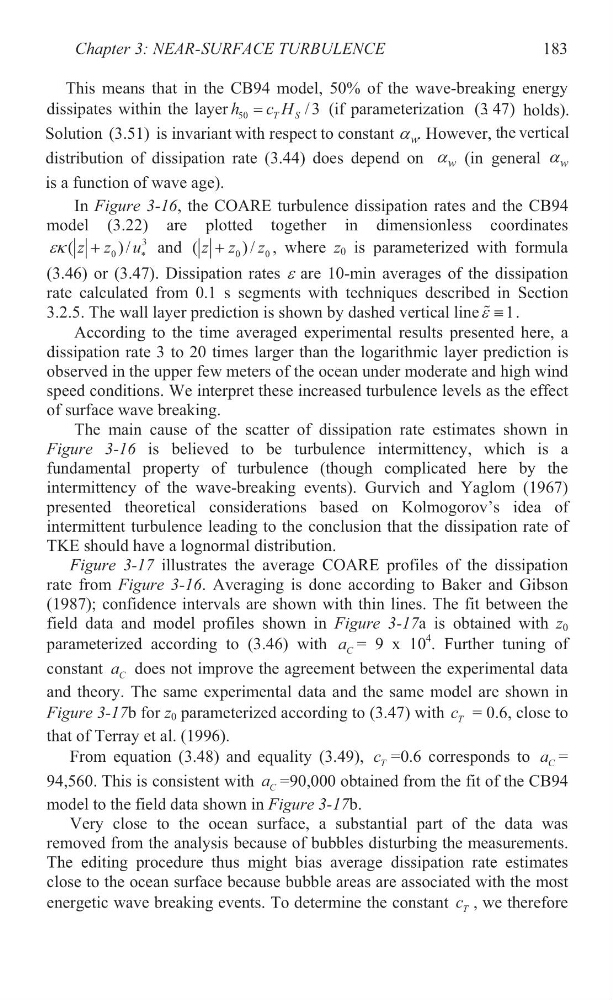
This means that in the CB94 model, 50% of the wave-breaking energy
50
T
S
holds).
Solution (3.51) is invariant with respect to constant w
D . However, the vertical
distribution of dissipation rate (3.44) does depend on w
D (in general w
D
is a function of wave age).
In Figure 3-16, the COARE turbulence dissipation rates and the CB94
model (3.22) are plotted together in dimensionless coordinates
3
0
(
)/
z z u
HN
and
0
0
(
)/
z z z
, where z 0 is parameterized with formula
(3.46) or (3.47). Dissipation rates H are 10-min averages of the dissipation
rate calculated from 0.1 s segments with techniques described in Section
3.2.5. The wall layer prediction is shown by dashed vertical line
1
H {
.
According to the time averaged experimental results presented here, a
dissipation rate 3 to 20 times larger than the logarithmic layer prediction is
observed in the upper few meters of the ocean under moderate and high wind
speed conditions. We interpret these increased turbulence levels as the effect
of surface wave breaking.
The main cause of the scatter of dissipation rate estimates shown in
Figure 3-16 is believed to be turbulence intermittency, which is a
fundamental property of turbulence (though complicated here by the
intermittency of the wave-breaking events). Gurvich and Yaglom (1967)
presented theoretical considerations based on Kolmogorov’s idea of
intermittent turbulence leading to the conclusion that the dissipation rate of
TKE should have a lognormal distribution.
Figure 3-17 illustrates the average COARE profiles of the dissipation
rate from Figure 3-16. Averaging is done according to Baker and Gibson
(1987); confidence intervals are shown with thin lines. The fit between the
field data and model profiles shown in Figure 3-17a is obtained with z 0
parameterized according to (3.46) with C
a = 9 x 10
4
. Further tuning of
constant C
a does not improve the agreement between the experimental data
and theory. The same experimental data and the same model are shown in
Figure 3-17b for z 0 parameterized according to (3.47) with T
c = 0.6, close to
that of Terray et al. (1996).
From equation (3.48) and equality (3.49), T
c =0.6 corresponds to C
a =
94,560. This is consistent with C
a =90,000 obtained from the fit of the CB94
model to the field data shown in Figure 3-17b.
Very close to the ocean surface, a substantial part of the data was
removed from the analysis because of bubbles disturbing the measurements.
The editing procedure thus might bias average dissipation rate estimates
close to the ocean surface because bubble areas are associated with the most
energetic wave breaking events. To determine the constant T
c , we therefore
Chapter 3: NEAR-SURFACE TURBULENCE
183
dissipates within the layer h
c H / 3 (if parameterization (3. 47)
50
T
S
holds).
Solution (3.51) is invariant with respect to constant w
D . However, the vertical
distribution of dissipation rate (3.44) does depend on w
D (in general w
D
is a function of wave age).
In Figure 3-16, the COARE turbulence dissipation rates and the CB94
model (3.22) are plotted together in dimensionless coordinates
3
0
(
)/
z z u
HN
and
0
0
(
)/
z z z
, where z 0 is parameterized with formula
(3.46) or (3.47). Dissipation rates H are 10-min averages of the dissipation
rate calculated from 0.1 s segments with techniques described in Section
3.2.5. The wall layer prediction is shown by dashed vertical line
1
H {
.
According to the time averaged experimental results presented here, a
dissipation rate 3 to 20 times larger than the logarithmic layer prediction is
observed in the upper few meters of the ocean under moderate and high wind
speed conditions. We interpret these increased turbulence levels as the effect
of surface wave breaking.
The main cause of the scatter of dissipation rate estimates shown in
Figure 3-16 is believed to be turbulence intermittency, which is a
fundamental property of turbulence (though complicated here by the
intermittency of the wave-breaking events). Gurvich and Yaglom (1967)
presented theoretical considerations based on Kolmogorov’s idea of
intermittent turbulence leading to the conclusion that the dissipation rate of
TKE should have a lognormal distribution.
Figure 3-17 illustrates the average COARE profiles of the dissipation
rate from Figure 3-16. Averaging is done according to Baker and Gibson
(1987); confidence intervals are shown with thin lines. The fit between the
field data and model profiles shown in Figure 3-17a is obtained with z 0
parameterized according to (3.46) with C
a = 9 x 10
4
. Further tuning of
constant C
a does not improve the agreement between the experimental data
and theory. The same experimental data and the same model are shown in
Figure 3-17b for z 0 parameterized according to (3.47) with T
c = 0.6, close to
that of Terray et al. (1996).
From equation (3.48) and equality (3.49), T
c =0.6 corresponds to C
a =
94,560. This is consistent with C
a =90,000 obtained from the fit of the CB94
model to the field data shown in Figure 3-17b.
Very close to the ocean surface, a substantial part of the data was
removed from the analysis because of bubbles disturbing the measurements.
The editing procedure thus might bias average dissipation rate estimates
close to the ocean surface because bubble areas are associated with the most
energetic wave breaking events. To determine the constant T
c , we therefore
Chapter 3: NEAR-SURFACE TURBULENCE
183
dissipates within the layer h
c H / 3 (if parameterization (3. 47)