

Present ocean circulation
39
2.3. Oceans and climate
Over the last decades, many techniques have become available to construct climatic records from geological, biological and physical data. These proxy records
show that climate variations on different time scales have been very common in
the past. The enormous amount of instrumental data that has been collected over
the last 150 years contributes in turn to a more and more complete picture of the
climate system’s variability.
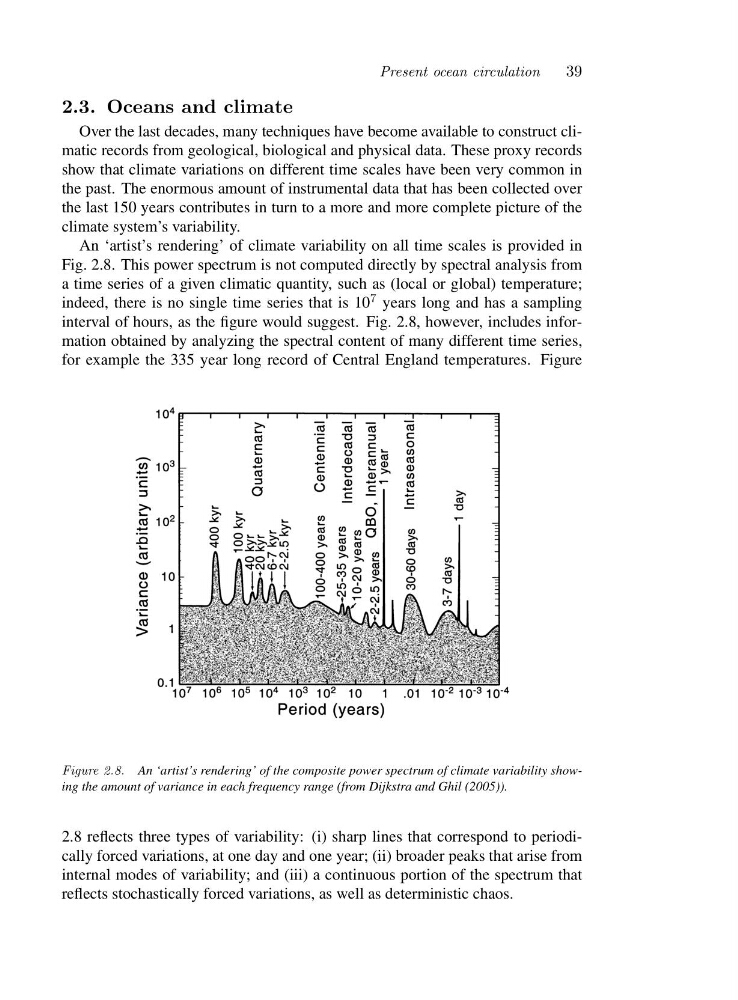
An ‘artist’s rendering’ of climate variability on all time scales is provided in
Fig. 2.8. This power spectrum is not computed directly by spectral analysis from
a time series of a given climatic quantity, such as (local or global) temperature;
indeed, there is no single time series that is 10 7 years long and has a sampling
interval of hours, as the figure would suggest. Fig. 2.8, however, includes information obtained by analyzing the spectral content of many different time series,
for example the 335 year long record of Central England temperatures. Figure
Figure 2.8. An ‘artist’s rendering’ of the composite power spectrum of climate variability showing the amount of variance in each frequency range (from Dijkstra and Ghil (2005)).
2.8 reflects three types of variability: (i) sharp lines that correspond to periodically forced variations, at one day and one year; (ii) broader peaks that arise from
internal modes of variability; and (iii) a continuous portion of the spectrum that
reflects stochastically forced variations, as well as deterministic chaos.
39
2.3. Oceans and climate
Over the last decades, many techniques have become available to construct climatic records from geological, biological and physical data. These proxy records
show that climate variations on different time scales have been very common in
the past. The enormous amount of instrumental data that has been collected over
the last 150 years contributes in turn to a more and more complete picture of the
climate system’s variability.
An ‘artist’s rendering’ of climate variability on all time scales is provided in
Fig. 2.8. This power spectrum is not computed directly by spectral analysis from
a time series of a given climatic quantity, such as (local or global) temperature;
indeed, there is no single time series that is 10 7 years long and has a sampling
interval of hours, as the figure would suggest. Fig. 2.8, however, includes information obtained by analyzing the spectral content of many different time series,
for example the 335 year long record of Central England temperatures. Figure
Figure 2.8. An ‘artist’s rendering’ of the composite power spectrum of climate variability showing the amount of variance in each frequency range (from Dijkstra and Ghil (2005)).
2.8 reflects three types of variability: (i) sharp lines that correspond to periodically forced variations, at one day and one year; (ii) broader peaks that arise from
internal modes of variability; and (iii) a continuous portion of the spectrum that
reflects stochastically forced variations, as well as deterministic chaos.