

354
DYNAMICAL OCEANOGRAPHY
(a)
(b)
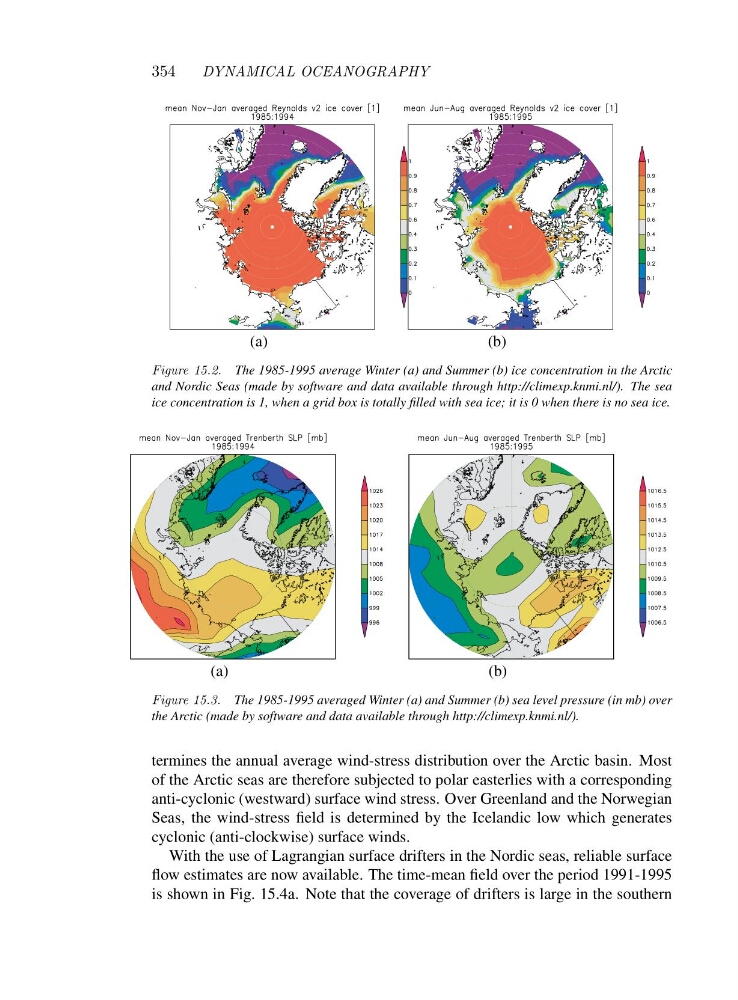
Figure 15.2. The 1985-1995 average Winter (a) and Summer (b) ice concentration in the Arctic
and Nordic Seas (made by software and data available through http://climexp.knmi.nl/). The sea
ice concentration is 1, when a grid box is totally filled with sea ice; it is 0 when there is no sea ice.
(a)
(b)
Figure 15.3. The 1985-1995 averaged Winter (a) and Summer (b) sea level pressure (in mb) over
the Arctic (made by software and data available through http://climexp.knmi.nl/).
termines the annual average wind-stress distribution over the Arctic basin. Most
of the Arctic seas are therefore subjected to polar easterlies with a corresponding
anti-cyclonic (westward) surface wind stress. Over Greenland and the Norwegian
Seas, the wind-stress field is determined by the Icelandic low which generates
cyclonic (anti-clockwise) surface winds.
With the use of Lagrangian surface drifters in the Nordic seas, reliable surface
flow estimates are now available. The time-mean field over the period 1991-1995
is shown in Fig. 15.4a. Note that the coverage of drifters is large in the southern
DYNAMICAL OCEANOGRAPHY
(a)
(b)
Figure 15.2. The 1985-1995 average Winter (a) and Summer (b) ice concentration in the Arctic
and Nordic Seas (made by software and data available through http://climexp.knmi.nl/). The sea
ice concentration is 1, when a grid box is totally filled with sea ice; it is 0 when there is no sea ice.
(a)
(b)
Figure 15.3. The 1985-1995 averaged Winter (a) and Summer (b) sea level pressure (in mb) over
the Arctic (made by software and data available through http://climexp.knmi.nl/).
termines the annual average wind-stress distribution over the Arctic basin. Most
of the Arctic seas are therefore subjected to polar easterlies with a corresponding
anti-cyclonic (westward) surface wind stress. Over Greenland and the Norwegian
Seas, the wind-stress field is determined by the Icelandic low which generates
cyclonic (anti-clockwise) surface winds.
With the use of Lagrangian surface drifters in the Nordic seas, reliable surface
flow estimates are now available. The time-mean field over the period 1991-1995
is shown in Fig. 15.4a. Note that the coverage of drifters is large in the southern