

12
DYNAMICAL OCEANOGRAPHY
relatively warm compared to water at the same latitude in the northern Pacific.
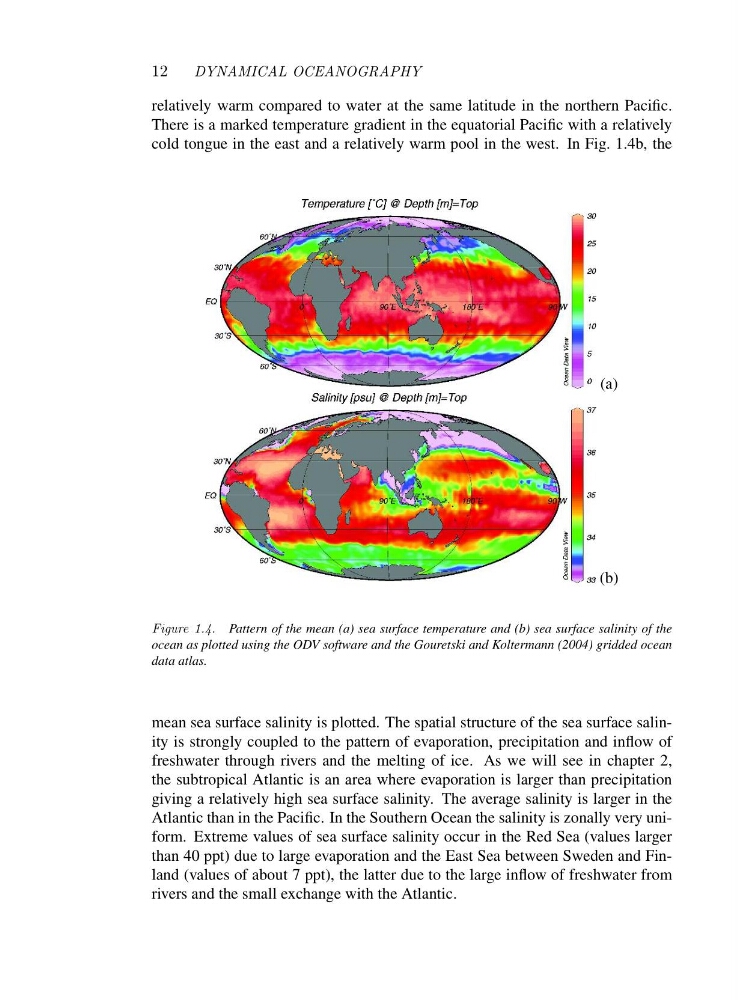
There is a marked temperature gradient in the equatorial Pacific with a relatively
cold tongue in the east and a relatively warm pool in the west. In Fig. 1.4b, the
(a)
(b)
Figure 1.4. Pattern of the mean (a) sea surface temperature and (b) sea surface salinity of the
ocean as plotted using the ODV software and the Gouretski and Koltermann (2004) gridded ocean
data atlas.
mean sea surface salinity is plotted. The spatial structure of the sea surface salinity is strongly coupled to the pattern of evaporation, precipitation and inflow of
freshwater through rivers and the melting of ice. As we will see in chapter 2,
the subtropical Atlantic is an area where evaporation is larger than precipitation
giving a relatively high sea surface salinity. The average salinity is larger in the
Atlantic than in the Pacific. In the Southern Ocean the salinity is zonally very uniform. Extreme values of sea surface salinity occur in the Red Sea (values larger
than 40 ppt) due to large evaporation and the East Sea between Sweden and Finland (values of about 7 ppt), the latter due to the large inflow of freshwater from
rivers and the small exchange with the Atlantic.
DYNAMICAL OCEANOGRAPHY
relatively warm compared to water at the same latitude in the northern Pacific.
There is a marked temperature gradient in the equatorial Pacific with a relatively
cold tongue in the east and a relatively warm pool in the west. In Fig. 1.4b, the
(a)
(b)
Figure 1.4. Pattern of the mean (a) sea surface temperature and (b) sea surface salinity of the
ocean as plotted using the ODV software and the Gouretski and Koltermann (2004) gridded ocean
data atlas.
mean sea surface salinity is plotted. The spatial structure of the sea surface salinity is strongly coupled to the pattern of evaporation, precipitation and inflow of
freshwater through rivers and the melting of ice. As we will see in chapter 2,
the subtropical Atlantic is an area where evaporation is larger than precipitation
giving a relatively high sea surface salinity. The average salinity is larger in the
Atlantic than in the Pacific. In the Southern Ocean the salinity is zonally very uniform. Extreme values of sea surface salinity occur in the Red Sea (values larger
than 40 ppt) due to large evaporation and the East Sea between Sweden and Finland (values of about 7 ppt), the latter due to the large inflow of freshwater from
rivers and the small exchange with the Atlantic.