

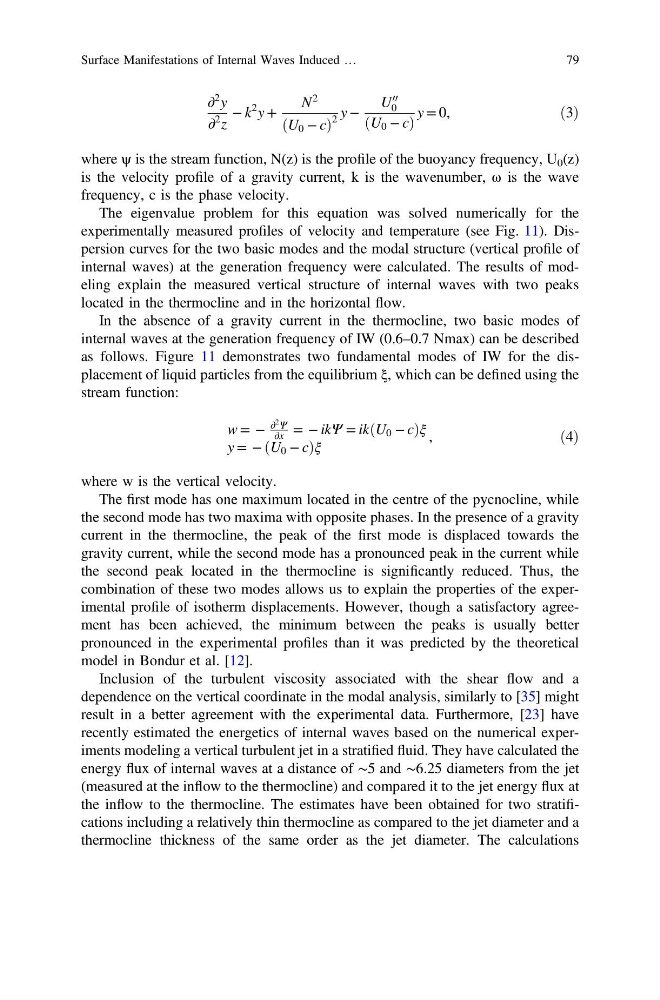
∂
2 y
∂
2 z
− k
2 y +
N
2
ðU 0 − cÞ
2
y −
U
00
0
ðU 0 − cÞ
y = 0,
ð3Þ
where ψ is the stream function, N(z) is the profile of the buoyancy frequency, U 0 (z)
is the velocity profile of a gravity current, k is the wavenumber, ω is the wave
frequency, c is the phase velocity.
The eigenvalue problem for this equation was solved numerically for the
experimentally measured profiles of velocity and temperature (see Fig. 11). Dispersion curves for the two basic modes and the modal structure (vertical profile of
internal waves) at the generation frequency were calculated. The results of modeling explain the measured vertical structure of internal waves with two peaks
located in the thermocline and in the horizontal flow.
In the absence of a gravity current in the thermocline, two basic modes of
internal waves at the generation frequency of IW (0.6–0.7 Nmax) can be described
as follows. Figure 11 demonstrates two fundamental modes of IW for the displacement of liquid particles from the equilibrium ξ, which can be defined using the
stream function:
w = −
∂
2 Ψ
∂x = − ikΨ = ikðU 0 − cÞξ
y = − ðU 0 − cÞξ
,
ð4Þ
where w is the vertical velocity.
The first mode has one maximum located in the centre of the pycnocline, while
the second mode has two maxima with opposite phases. In the presence of a gravity
current in the thermocline, the peak of the first mode is displaced towards the
gravity current, while the second mode has a pronounced peak in the current while
the second peak located in the thermocline is significantly reduced. Thus, the
combination of these two modes allows us to explain the properties of the experimental profile of isotherm displacements. However, though a satisfactory agreement has been achieved, the minimum between the peaks is usually better
pronounced in the experimental profiles than it was predicted by the theoretical
model in Bondur et al. [12].
Inclusion of the turbulent viscosity associated with the shear flow and a
dependence on the vertical coordinate in the modal analysis, similarly to [35] might
result in a better agreement with the experimental data. Furthermore, [23] have
recently estimated the energetics of internal waves based on the numerical experiments modeling a vertical turbulent jet in a stratified fluid. They have calculated the
energy flux of internal waves at a distance of ∼5 and ∼6.25 diameters from the jet
(measured at the inflow to the thermocline) and compared it to the jet energy flux at
the inflow to the thermocline. The estimates have been obtained for two stratifications including a relatively thin thermocline as compared to the jet diameter and a
thermocline thickness of the same order as the jet diameter. The calculations
Surface Manifestations of Internal Waves Induced …
79
2 y
∂
2 z
− k
2 y +
N
2
ðU 0 − cÞ
2
y −
U
00
0
ðU 0 − cÞ
y = 0,
ð3Þ
where ψ is the stream function, N(z) is the profile of the buoyancy frequency, U 0 (z)
is the velocity profile of a gravity current, k is the wavenumber, ω is the wave
frequency, c is the phase velocity.
The eigenvalue problem for this equation was solved numerically for the
experimentally measured profiles of velocity and temperature (see Fig. 11). Dispersion curves for the two basic modes and the modal structure (vertical profile of
internal waves) at the generation frequency were calculated. The results of modeling explain the measured vertical structure of internal waves with two peaks
located in the thermocline and in the horizontal flow.
In the absence of a gravity current in the thermocline, two basic modes of
internal waves at the generation frequency of IW (0.6–0.7 Nmax) can be described
as follows. Figure 11 demonstrates two fundamental modes of IW for the displacement of liquid particles from the equilibrium ξ, which can be defined using the
stream function:
w = −
∂
2 Ψ
∂x = − ikΨ = ikðU 0 − cÞξ
y = − ðU 0 − cÞξ
,
ð4Þ
where w is the vertical velocity.
The first mode has one maximum located in the centre of the pycnocline, while
the second mode has two maxima with opposite phases. In the presence of a gravity
current in the thermocline, the peak of the first mode is displaced towards the
gravity current, while the second mode has a pronounced peak in the current while
the second peak located in the thermocline is significantly reduced. Thus, the
combination of these two modes allows us to explain the properties of the experimental profile of isotherm displacements. However, though a satisfactory agreement has been achieved, the minimum between the peaks is usually better
pronounced in the experimental profiles than it was predicted by the theoretical
model in Bondur et al. [12].
Inclusion of the turbulent viscosity associated with the shear flow and a
dependence on the vertical coordinate in the modal analysis, similarly to [35] might
result in a better agreement with the experimental data. Furthermore, [23] have
recently estimated the energetics of internal waves based on the numerical experiments modeling a vertical turbulent jet in a stratified fluid. They have calculated the
energy flux of internal waves at a distance of ∼5 and ∼6.25 diameters from the jet
(measured at the inflow to the thermocline) and compared it to the jet energy flux at
the inflow to the thermocline. The estimates have been obtained for two stratifications including a relatively thin thermocline as compared to the jet diameter and a
thermocline thickness of the same order as the jet diameter. The calculations
Surface Manifestations of Internal Waves Induced …
79