

Analysis of the Tests Data
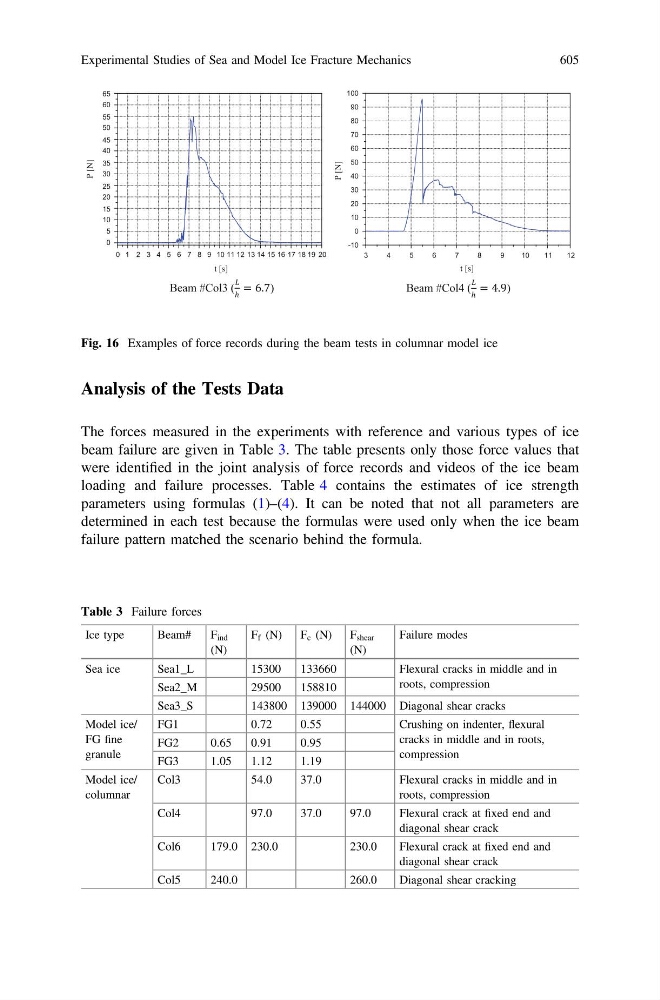
The forces measured in the experiments with reference and various types of ice
beam failure are given in Table 3. The table presents only those force values that
were identified in the joint analysis of force records and videos of the ice beam
loading and failure processes. Table 4 contains the estimates of ice strength
parameters using formulas (1)–(4). It can be noted that not all parameters are
determined in each test because the formulas were used only when the ice beam
failure pattern matched the scenario behind the formula.
Beam #Col3 ( ℎ
= 6.7)
Beam #Col4 (
ℎ
= 4.9)
0 1 2 3 4 5 6 7 8 9 10 11 12 13 14 15 16 17 18 19 20
0
5
10
15
20
25
30
35
40
45
50
55
60
65
P [N]
t [s]
3
4
5
6
7
8
9
1 0
1 1
1 2
-10
0
10
20
30
40
50
60
70
80
90
100
P [N]
t [s]
Fig. 16 Examples of force records during the beam tests in columnar model ice
Table 3 Failure forces
Ice type
Beam#
F ind
(N)
F f (N)
F c (N)
F shear
(N)
Failure modes
Sea ice
Sea1_L
15300
133660
Flexural cracks in middle and in
roots, compression
Sea2_M
29500
158810
Sea3_S
143800 139000 144000 Diagonal shear cracks
Model ice/
FG fine
granule
FG1
0.72
0.55
Crushing on indenter, flexural
cracks in middle and in roots,
compression
FG2
0.65
0.91
0.95
FG3
1.05
1.12
1.19
Model ice/
columnar
Col3
54.0
37.0
Flexural cracks in middle and in
roots, compression
Col4
97.0
37.0
97.0
Flexural crack at fixed end and
diagonal shear crack
Col6
179.0 230.0
230.0
Flexural crack at fixed end and
diagonal shear crack
Col5
240.0
260.0
Diagonal shear cracking
Experimental Studies of Sea and Model Ice Fracture Mechanics
605