

FG Model Ice
Tests of the FG model ice beams with length ratios of 3.6 ≤
L
h ≤ 6.9 have revealed
two characteristic features of their failure patterns:
(1) ice crushing under indenter forcing in the initial phase of loading;
(2) absence of diagonal cracks and shear.
The first feature is related to lower crushing strength of the model ice as compared to the required value according to the similitude law. In the case of relatively
long beams the indenter penetration (until flexural cracking) lasted almost 0.5 s; the
tests with a shorter beam (
L
h = 3.6) showed a vivid penetration pattern during 2.5 s,
as can be seen from the load time history (Fig. 12) and the force record (Fig. 13).
In all cases, the failure pattern involved flexural cracking at mid-length and root
sections of the beams followed by compression at further deformation of beams. All
the failure processes are illustrated in Fig. 14, in which broken beam #FG2 is
shown.
Values of parameter β are based on the visual data (photos and video records).
The values are β ≅ 0.4 for the relatively long beam (
L
h = 6.9Þ and β ≅ 0.5 for the
other two beams.
The ice strength values given in Table 4 show that:
• the ice flexural strength under horizontal loading of the beam is much smaller
than the one under vertical bending of the beam;
• the ice compressive strength is too low, and the ratio of compression strength to
flexural strength is close to unity.
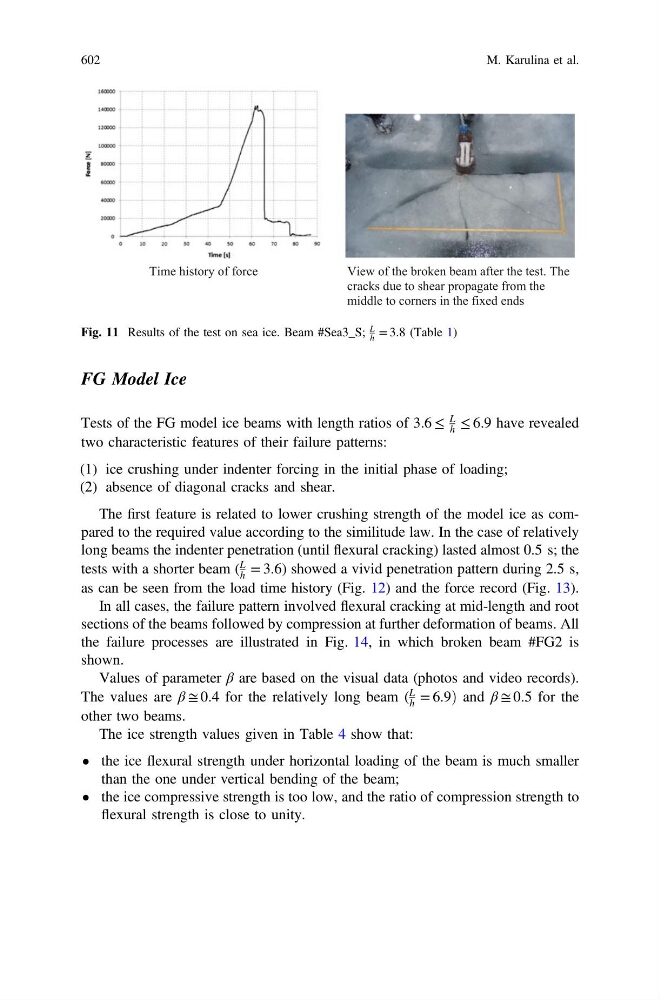
Time history of force
View of the broken beam after the test. The
cracks due to shear propagate from the
middle to corners in the fixed ends
Fig. 11 Results of the test on sea ice. Beam #Sea3_S;
L
h = 3.8 (Table 1)
602
M. Karulina et al.