

Therefore, diverse behaviour of the beam under load can be expected for different
ice types, as well as different influence of beam dimensions on failure patterns.
It should be noted that both sea and model ice have non-homogeneous structure
and non-uniform properties across the ice thickness. In this study the influence of
this factor on the results is not analyzed. Since this study is using averaged integral
characteristics (referred to the total ice thickness), we can expect that if the effect
due to ice non-uniformities across thickness is taken into account, it might somewhat change the quantitative estimates, but the conclusions will remain principally
the same.
The Test Results
Sea Ice
The tests in the sea ice have generally confirmed the conclusions made in the earlier
study [9]. In the test with loading relatively long beams (
L
h = 7.6 and
L
h = 5.5), the
flexural cracking in the mid-length and root sections of the beam were observed
(according to the scheme in Fig. 2a), then the load level was governed by the ice
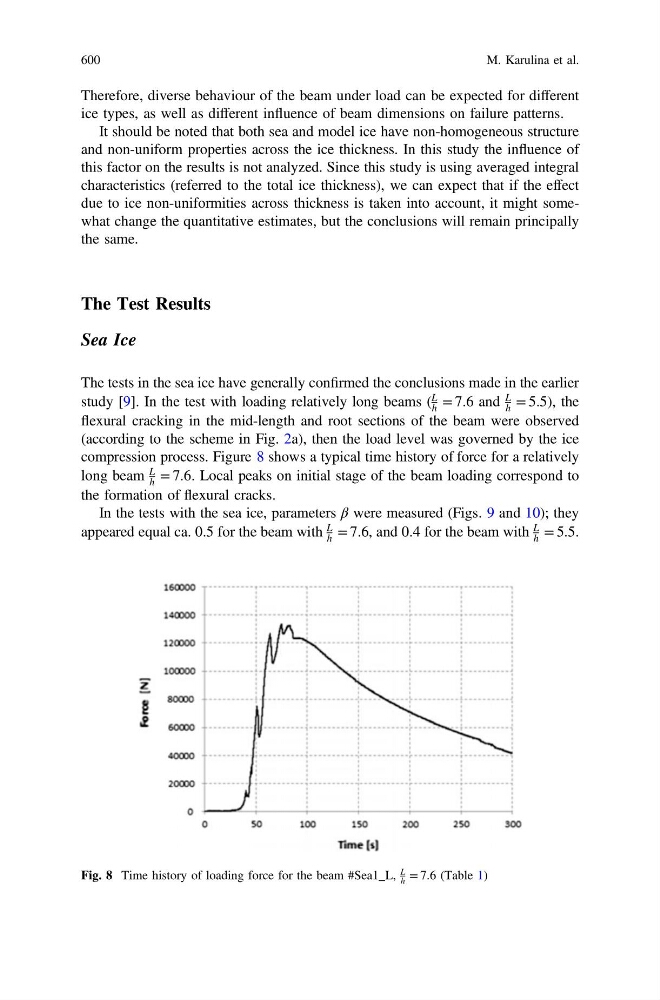
compression process. Figure 8 shows a typical time history of force for a relatively
long beam
L
h = 7.6. Local peaks on initial stage of the beam loading correspond to
the formation of flexural cracks.
In the tests with the sea ice, parameters β were measured (Figs. 9 and 10); they
appeared equal ca. 0.5 for the beam with
L
h = 7.6, and 0.4 for the beam with
L
h = 5.5.
Fig. 8 Time history of loading force for the beam #Sea1_L,
L
h = 7.6 (Table 1)
600
M. Karulina et al.