

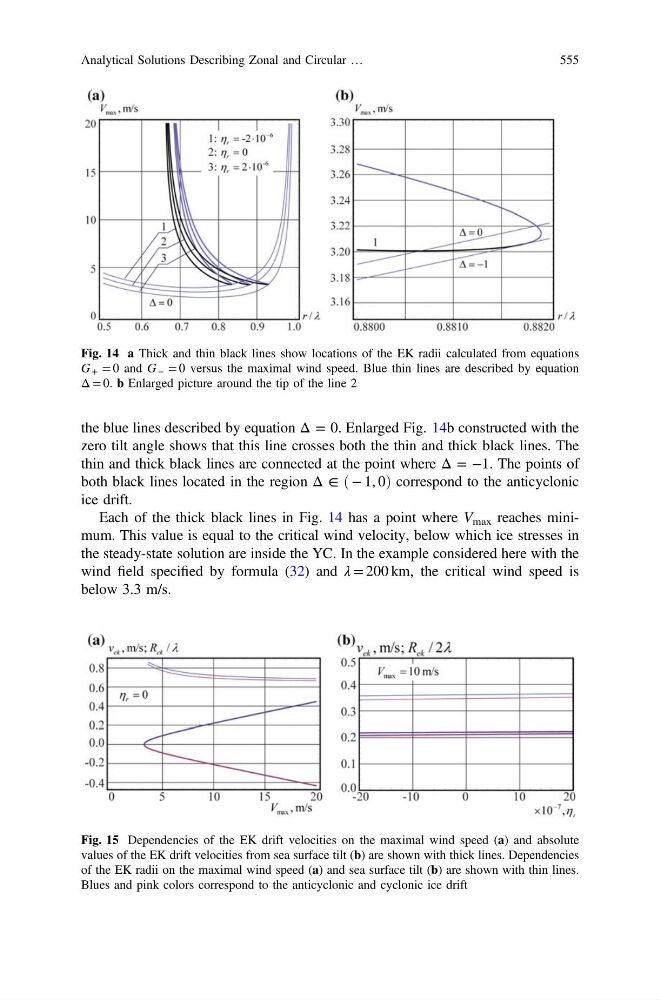
the blue lines described by equation Δ = 0. Enlarged Fig. 14b constructed with the
zero tilt angle shows that this line crosses both the thin and thick black lines. The
thin and thick black lines are connected at the point where Δ = −1. The points of
both black lines located in the region Δ ∈ ð − 1, 0Þ correspond to the anticyclonic
ice drift.
Each of the thick black lines in Fig. 14 has a point where V max reaches minimum. This value is equal to the critical wind velocity, below which ice stresses in
the steady-state solution are inside the YC. In the example considered here with the
wind field specified by formula (32) and λ = 200 km, the critical wind speed is
below 3.3 m/s.
Fig. 14 a Thick and thin black lines show locations of the EK radii calculated from equations
G + = 0 and G − = 0 versus the maximal wind speed. Blue thin lines are described by equation
Δ = 0. b Enlarged picture around the tip of the line 2
Fig. 15 Dependencies of the EK drift velocities on the maximal wind speed (a) and absolute
values of the EK drift velocities from sea surface tilt (b) are shown with thick lines. Dependencies
of the EK radii on the maximal wind speed (a) and sea surface tilt (b) are shown with thin lines.
Blues and pink colors correspond to the anticyclonic and cyclonic ice drift
Analytical Solutions Describing Zonal and Circular …
555
zero tilt angle shows that this line crosses both the thin and thick black lines. The
thin and thick black lines are connected at the point where Δ = −1. The points of
both black lines located in the region Δ ∈ ð − 1, 0Þ correspond to the anticyclonic
ice drift.
Each of the thick black lines in Fig. 14 has a point where V max reaches minimum. This value is equal to the critical wind velocity, below which ice stresses in
the steady-state solution are inside the YC. In the example considered here with the
wind field specified by formula (32) and λ = 200 km, the critical wind speed is
below 3.3 m/s.
Fig. 14 a Thick and thin black lines show locations of the EK radii calculated from equations
G + = 0 and G − = 0 versus the maximal wind speed. Blue thin lines are described by equation
Δ = 0. b Enlarged picture around the tip of the line 2
Fig. 15 Dependencies of the EK drift velocities on the maximal wind speed (a) and absolute
values of the EK drift velocities from sea surface tilt (b) are shown with thick lines. Dependencies
of the EK radii on the maximal wind speed (a) and sea surface tilt (b) are shown with thin lines.
Blues and pink colors correspond to the anticyclonic and cyclonic ice drift
Analytical Solutions Describing Zonal and Circular …
555