

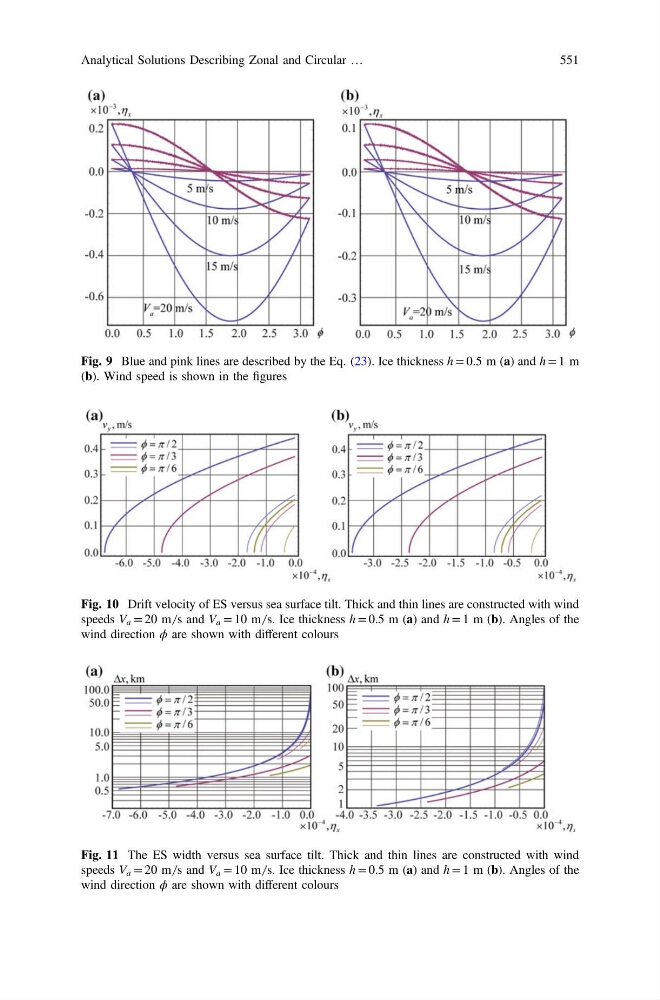
Fig. 9 Blue and pink lines are described by the Eq. (23). Ice thickness h = 0.5 m (a) and h = 1 m
(b). Wind speed is shown in the figures
Fig. 10 Drift velocity of ES versus sea surface tilt. Thick and thin lines are constructed with wind
speeds V a = 20 m ̸ s and V a = 10 m ̸ s. Ice thickness h = 0.5 m (a) and h = 1 m (b). Angles of the
wind direction ϕ are shown with different colours
Fig. 11 The ES width versus sea surface tilt. Thick and thin lines are constructed with wind
speeds V a = 20 m ̸ s and V a = 10 m ̸ s. Ice thickness h = 0.5 m (a) and h = 1 m (b). Angles of the
wind direction ϕ are shown with different colours
Analytical Solutions Describing Zonal and Circular …
551
(b). Wind speed is shown in the figures
Fig. 10 Drift velocity of ES versus sea surface tilt. Thick and thin lines are constructed with wind
speeds V a = 20 m ̸ s and V a = 10 m ̸ s. Ice thickness h = 0.5 m (a) and h = 1 m (b). Angles of the
wind direction ϕ are shown with different colours
Fig. 11 The ES width versus sea surface tilt. Thick and thin lines are constructed with wind
speeds V a = 20 m ̸ s and V a = 10 m ̸ s. Ice thickness h = 0.5 m (a) and h = 1 m (b). Angles of the
wind direction ϕ are shown with different colours
Analytical Solutions Describing Zonal and Circular …
551