

Since the ice motion is caused by the wind it is assumed that
v y V ay ≥ 0.
ð16Þ
The drift velocity v y and the ES width Δx are calculated from the momentum
balance integrated over the ES width
2
3
hP
* = ρ i hfv y + ρ a C a V a V ax − ρ i ghη x
À
Á Δx,
ð17Þ
2
3
ffiffiffiffiffi
3γ
p hP
* = ρ a C a V a jV ay j − ρ w C w v
2
y
Δx.
ð18Þ
It follows from Eq. (17) that there is the only solution describing the ice drift to
the “north” when V ax = 0 and η x = 0. The ES width is found as a root of Eq. (18)
solved with respect to Δx after the substitution of v y from Eq. (17). Locations of the
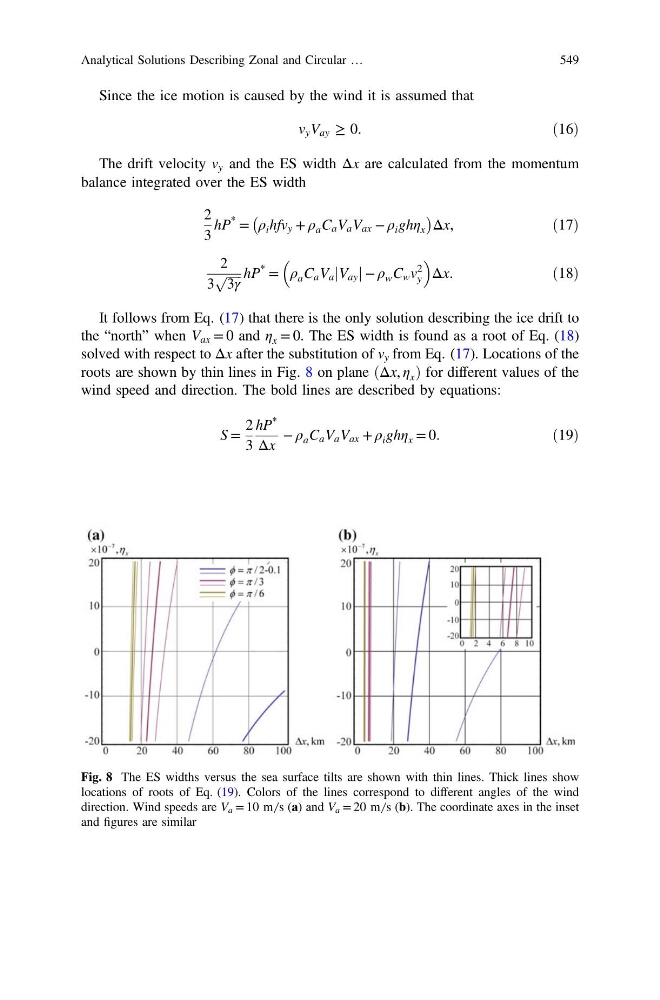
roots are shown by thin lines in Fig. 8 on plane ðΔx, η x Þ for different values of the
wind speed and direction. The bold lines are described by equations:
S =
2
3
hP
*
Δx
− ρ a C a V a V ax + ρ i ghη x = 0.
ð19Þ
Fig. 8 The ES widths versus the sea surface tilts are shown with thin lines. Thick lines show
locations of roots of Eq. (19). Colors of the lines correspond to different angles of the wind
direction. Wind speeds are V a = 10 m ̸ s (a) and V a = 20 m ̸ s (b). The coordinate axes in the inset
and figures are similar
Analytical Solutions Describing Zonal and Circular …
549
v y V ay ≥ 0.
ð16Þ
The drift velocity v y and the ES width Δx are calculated from the momentum
balance integrated over the ES width
2
3
hP
* = ρ i hfv y + ρ a C a V a V ax − ρ i ghη x
À
Á Δx,
ð17Þ
2
3
ffiffiffiffiffi
3γ
p hP
* = ρ a C a V a jV ay j − ρ w C w v
2
y
Δx.
ð18Þ
It follows from Eq. (17) that there is the only solution describing the ice drift to
the “north” when V ax = 0 and η x = 0. The ES width is found as a root of Eq. (18)
solved with respect to Δx after the substitution of v y from Eq. (17). Locations of the
roots are shown by thin lines in Fig. 8 on plane ðΔx, η x Þ for different values of the
wind speed and direction. The bold lines are described by equations:
S =
2
3
hP
*
Δx
− ρ a C a V a V ax + ρ i ghη x = 0.
ð19Þ
Fig. 8 The ES widths versus the sea surface tilts are shown with thin lines. Thick lines show
locations of roots of Eq. (19). Colors of the lines correspond to different angles of the wind
direction. Wind speeds are V a = 10 m ̸ s (a) and V a = 20 m ̸ s (b). The coordinate axes in the inset
and figures are similar
Analytical Solutions Describing Zonal and Circular …
549