

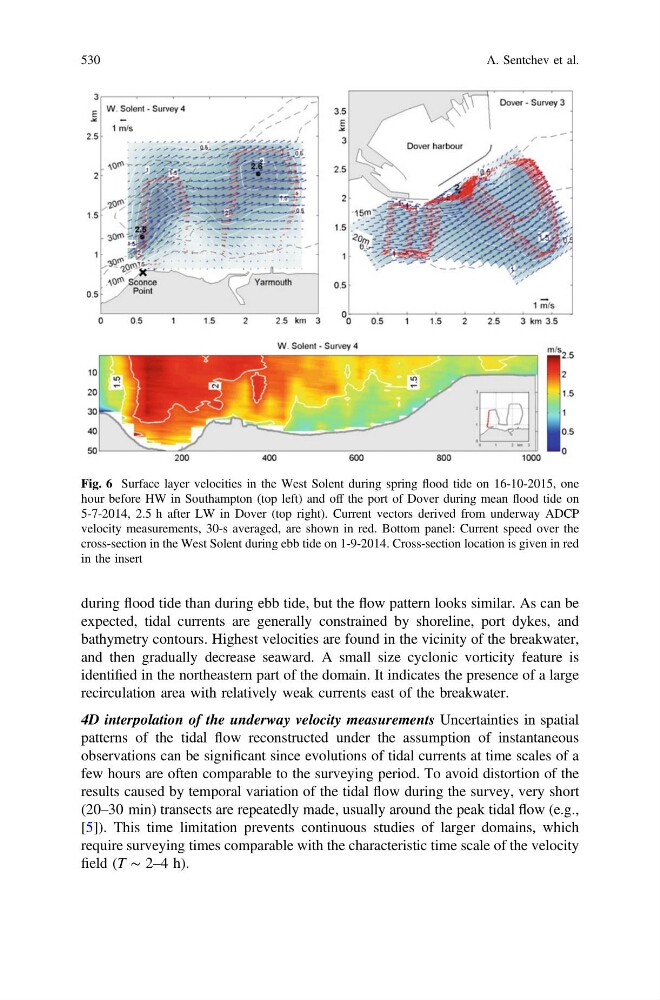
during flood tide than during ebb tide, but the flow pattern looks similar. As can be
expected, tidal currents are generally constrained by shoreline, port dykes, and
bathymetry contours. Highest velocities are found in the vicinity of the breakwater,
and then gradually decrease seaward. A small size cyclonic vorticity feature is
identified in the northeastern part of the domain. It indicates the presence of a large
recirculation area with relatively weak currents east of the breakwater.
4D interpolation of the underway velocity measurements Uncertainties in spatial
patterns of the tidal flow reconstructed under the assumption of instantaneous
observations can be significant since evolutions of tidal currents at time scales of a
few hours are often comparable to the surveying period. To avoid distortion of the
results caused by temporal variation of the tidal flow during the survey, very short
(20–30 min) transects are repeatedly made, usually around the peak tidal flow (e.g.,
[5]). This time limitation prevents continuous studies of larger domains, which
require surveying times comparable with the characteristic time scale of the velocity
field (T ∼ 2–4 h).
Fig. 6 Surface layer velocities in the West Solent during spring flood tide on 16-10-2015, one
hour before HW in Southampton (top left) and off the port of Dover during mean flood tide on
5-7-2014, 2.5 h after LW in Dover (top right). Current vectors derived from underway ADCP
velocity measurements, 30-s averaged, are shown in red. Bottom panel: Current speed over the
cross-section in the West Solent during ebb tide on 1-9-2014. Cross-section location is given in red
in the insert
530
A. Sentchev et al.
expected, tidal currents are generally constrained by shoreline, port dykes, and
bathymetry contours. Highest velocities are found in the vicinity of the breakwater,
and then gradually decrease seaward. A small size cyclonic vorticity feature is
identified in the northeastern part of the domain. It indicates the presence of a large
recirculation area with relatively weak currents east of the breakwater.
4D interpolation of the underway velocity measurements Uncertainties in spatial
patterns of the tidal flow reconstructed under the assumption of instantaneous
observations can be significant since evolutions of tidal currents at time scales of a
few hours are often comparable to the surveying period. To avoid distortion of the
results caused by temporal variation of the tidal flow during the survey, very short
(20–30 min) transects are repeatedly made, usually around the peak tidal flow (e.g.,
[5]). This time limitation prevents continuous studies of larger domains, which
require surveying times comparable with the characteristic time scale of the velocity
field (T ∼ 2–4 h).
Fig. 6 Surface layer velocities in the West Solent during spring flood tide on 16-10-2015, one
hour before HW in Southampton (top left) and off the port of Dover during mean flood tide on
5-7-2014, 2.5 h after LW in Dover (top right). Current vectors derived from underway ADCP
velocity measurements, 30-s averaged, are shown in red. Bottom panel: Current speed over the
cross-section in the West Solent during ebb tide on 1-9-2014. Cross-section location is given in red
in the insert
530
A. Sentchev et al.