

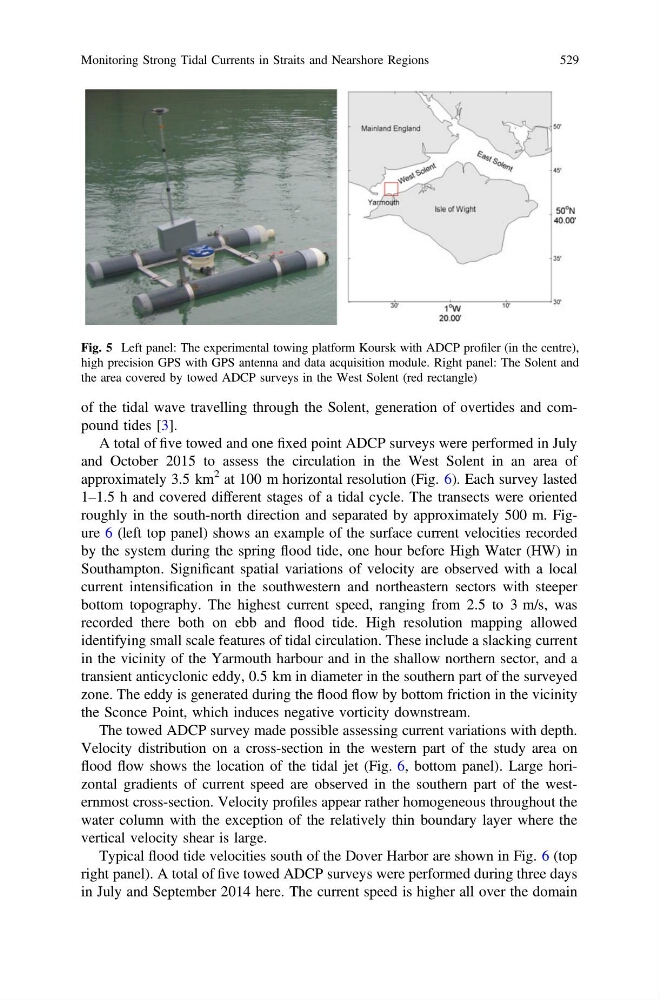
Fig. 5 Left panel: The experimental towing platform Koursk with ADCP profiler (in the centre),
high precision GPS with GPS antenna and data acquisition module. Right panel: The Solent and
the area covered by towed ADCP surveys in the West Solent (red rectangle)
of the tidal wave travelling through the Solent, generation of overtides and compound tides [3].
A total of five towed and one fixed point ADCP surveys were performed in July
and October 2015 to assess the circulation in the West Solent in an area of
approximately 3.5 km
2 at 100 m horizontal resolution (Fig. 6). Each survey lasted
1–1.5 h and covered different stages of a tidal cycle. The transects were oriented
roughly in the south-north direction and separated by approximately 500 m. Figure 6 (left top panel) shows an example of the surface current velocities recorded
by the system during the spring flood tide, one hour before High Water (HW) in
Southampton. Significant spatial variations of velocity are observed with a local
current intensification in the southwestern and northeastern sectors with steeper
bottom topography. The highest current speed, ranging from 2.5 to 3 m/s, was
recorded there both on ebb and flood tide. High resolution mapping allowed
identifying small scale features of tidal circulation. These include a slacking current
in the vicinity of the Yarmouth harbour and in the shallow northern sector, and a
transient anticyclonic eddy, 0.5 km in diameter in the southern part of the surveyed
zone. The eddy is generated during the flood flow by bottom friction in the vicinity
the Sconce Point, which induces negative vorticity downstream.
The towed ADCP survey made possible assessing current variations with depth.
Velocity distribution on a cross-section in the western part of the study area on
flood flow shows the location of the tidal jet (Fig. 6, bottom panel). Large horizontal gradients of current speed are observed in the southern part of the westernmost cross-section. Velocity profiles appear rather homogeneous throughout the
water column with the exception of the relatively thin boundary layer where the
vertical velocity shear is large.
Typical flood tide velocities south of the Dover Harbor are shown in Fig. 6 (top
right panel). A total of five towed ADCP surveys were performed during three days
in July and September 2014 here. The current speed is higher all over the domain
Monitoring Strong Tidal Currents in Straits and Nearshore Regions
529
high precision GPS with GPS antenna and data acquisition module. Right panel: The Solent and
the area covered by towed ADCP surveys in the West Solent (red rectangle)
of the tidal wave travelling through the Solent, generation of overtides and compound tides [3].
A total of five towed and one fixed point ADCP surveys were performed in July
and October 2015 to assess the circulation in the West Solent in an area of
approximately 3.5 km
2 at 100 m horizontal resolution (Fig. 6). Each survey lasted
1–1.5 h and covered different stages of a tidal cycle. The transects were oriented
roughly in the south-north direction and separated by approximately 500 m. Figure 6 (left top panel) shows an example of the surface current velocities recorded
by the system during the spring flood tide, one hour before High Water (HW) in
Southampton. Significant spatial variations of velocity are observed with a local
current intensification in the southwestern and northeastern sectors with steeper
bottom topography. The highest current speed, ranging from 2.5 to 3 m/s, was
recorded there both on ebb and flood tide. High resolution mapping allowed
identifying small scale features of tidal circulation. These include a slacking current
in the vicinity of the Yarmouth harbour and in the shallow northern sector, and a
transient anticyclonic eddy, 0.5 km in diameter in the southern part of the surveyed
zone. The eddy is generated during the flood flow by bottom friction in the vicinity
the Sconce Point, which induces negative vorticity downstream.
The towed ADCP survey made possible assessing current variations with depth.
Velocity distribution on a cross-section in the western part of the study area on
flood flow shows the location of the tidal jet (Fig. 6, bottom panel). Large horizontal gradients of current speed are observed in the southern part of the westernmost cross-section. Velocity profiles appear rather homogeneous throughout the
water column with the exception of the relatively thin boundary layer where the
vertical velocity shear is large.
Typical flood tide velocities south of the Dover Harbor are shown in Fig. 6 (top
right panel). A total of five towed ADCP surveys were performed during three days
in July and September 2014 here. The current speed is higher all over the domain
Monitoring Strong Tidal Currents in Straits and Nearshore Regions
529