

prescribed gently shallowing seaward interface between the two layers at a depth of
about 10 m. Coefficients μ 1 and μ 2 are 3 × 10
−3 m
2 /s and 3 × 10
−4 m
2 /s,
respectively.
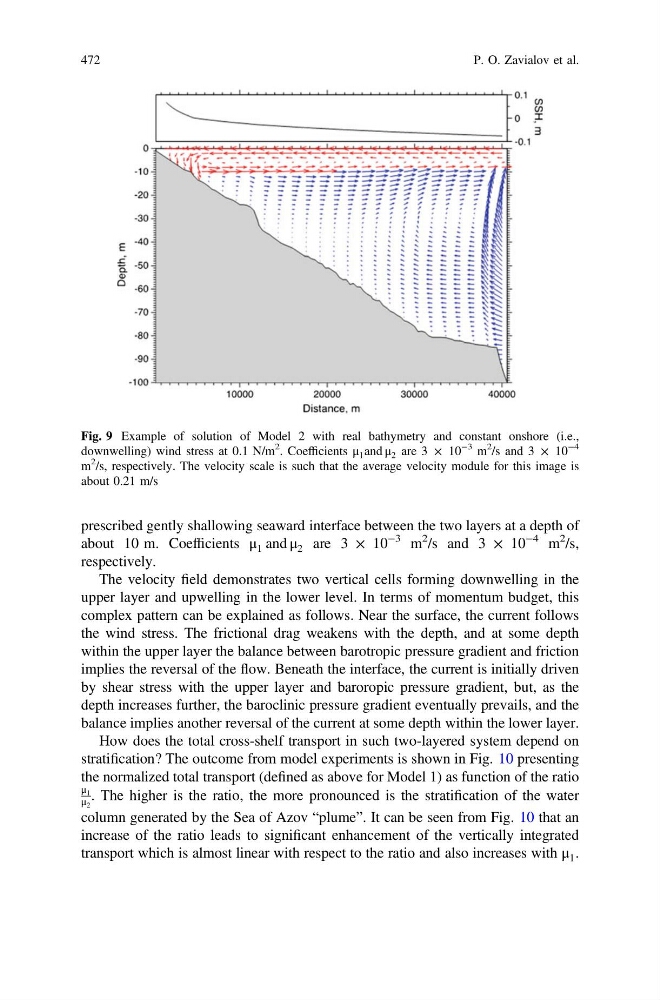
The velocity field demonstrates two vertical cells forming downwelling in the
upper layer and upwelling in the lower level. In terms of momentum budget, this
complex pattern can be explained as follows. Near the surface, the current follows
the wind stress. The frictional drag weakens with the depth, and at some depth
within the upper layer the balance between barotropic pressure gradient and friction
implies the reversal of the flow. Beneath the interface, the current is initially driven
by shear stress with the upper layer and baroropic pressure gradient, but, as the
depth increases further, the baroclinic pressure gradient eventually prevails, and the
balance implies another reversal of the current at some depth within the lower layer.
How does the total cross-shelf transport in such two-layered system depend on
stratification? The outcome from model experiments is shown in Fig. 10 presenting
the normalized total transport (defined as above for Model 1) as function of the ratio
μ 1
μ 2
. The higher is the ratio, the more pronounced is the stratification of the water
column generated by the Sea of Azov “plume”. It can be seen from Fig. 10 that an
increase of the ratio leads to significant enhancement of the vertically integrated
transport which is almost linear with respect to the ratio and also increases with μ 1 .
Fig. 9 Example of solution of Model 2 with real bathymetry and constant onshore (i.e.,
downwelling) wind stress at 0.1 N/m
2
. Coefficients μ 1 and μ 2 are 3 × 10
−3 m
2
/s and 3 × 10
−4
m
2
/s, respectively. The velocity scale is such that the average velocity module for this image is
about 0.21 m/s
472
P. O. Zavialov et al.
about 10 m. Coefficients μ 1 and μ 2 are 3 × 10
−3 m
2 /s and 3 × 10
−4 m
2 /s,
respectively.
The velocity field demonstrates two vertical cells forming downwelling in the
upper layer and upwelling in the lower level. In terms of momentum budget, this
complex pattern can be explained as follows. Near the surface, the current follows
the wind stress. The frictional drag weakens with the depth, and at some depth
within the upper layer the balance between barotropic pressure gradient and friction
implies the reversal of the flow. Beneath the interface, the current is initially driven
by shear stress with the upper layer and baroropic pressure gradient, but, as the
depth increases further, the baroclinic pressure gradient eventually prevails, and the
balance implies another reversal of the current at some depth within the lower layer.
How does the total cross-shelf transport in such two-layered system depend on
stratification? The outcome from model experiments is shown in Fig. 10 presenting
the normalized total transport (defined as above for Model 1) as function of the ratio
μ 1
μ 2
. The higher is the ratio, the more pronounced is the stratification of the water
column generated by the Sea of Azov “plume”. It can be seen from Fig. 10 that an
increase of the ratio leads to significant enhancement of the vertically integrated
transport which is almost linear with respect to the ratio and also increases with μ 1 .
Fig. 9 Example of solution of Model 2 with real bathymetry and constant onshore (i.e.,
downwelling) wind stress at 0.1 N/m
2
. Coefficients μ 1 and μ 2 are 3 × 10
−3 m
2
/s and 3 × 10
−4
m
2
/s, respectively. The velocity scale is such that the average velocity module for this image is
about 0.21 m/s
472
P. O. Zavialov et al.