

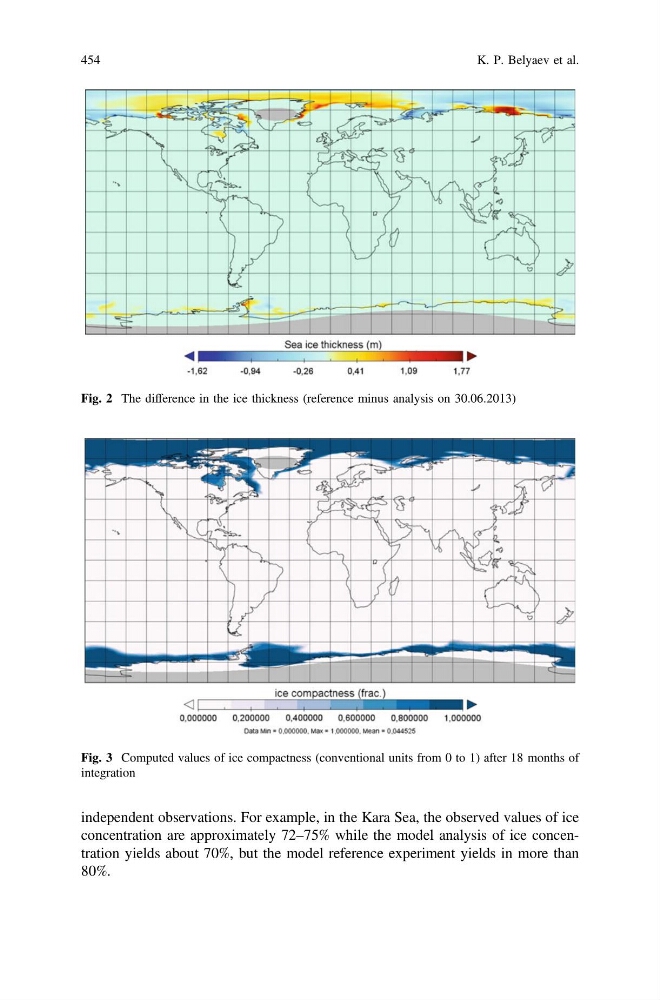
independent observations. For example, in the Kara Sea, the observed values of ice
concentration are approximately 72–75% while the model analysis of ice concentration yields about 70%, but the model reference experiment yields in more than
80%.
Fig. 2 The difference in the ice thickness (reference minus analysis on 30.06.2013)
Fig. 3 Computed values of ice compactness (conventional units from 0 to 1) after 18 months of
integration
454
K. P. Belyaev et al.
concentration are approximately 72–75% while the model analysis of ice concentration yields about 70%, but the model reference experiment yields in more than
80%.
Fig. 2 The difference in the ice thickness (reference minus analysis on 30.06.2013)
Fig. 3 Computed values of ice compactness (conventional units from 0 to 1) after 18 months of
integration
454
K. P. Belyaev et al.