

profile of density (Fig. 3). The minima are within the well-mixed portions of
steps and maxima are related to the high-gradient portions.
(4) The fourth, lowest interval with the minimum mean values of stability is the
transition region to the intermediate water salinity minimum. It is characterized
by the lowest gradients of thermohaline parameters. The mean values of E θ, S do
not exceed the first tens of units, while in the range of depths of 550–700 m the
minimum values equal to zero or even minimal negative values are observed.
This provides evidence about the neutral and weakly negative stability in some
depth intervals in the transition region to the intermediate salinity minimum.
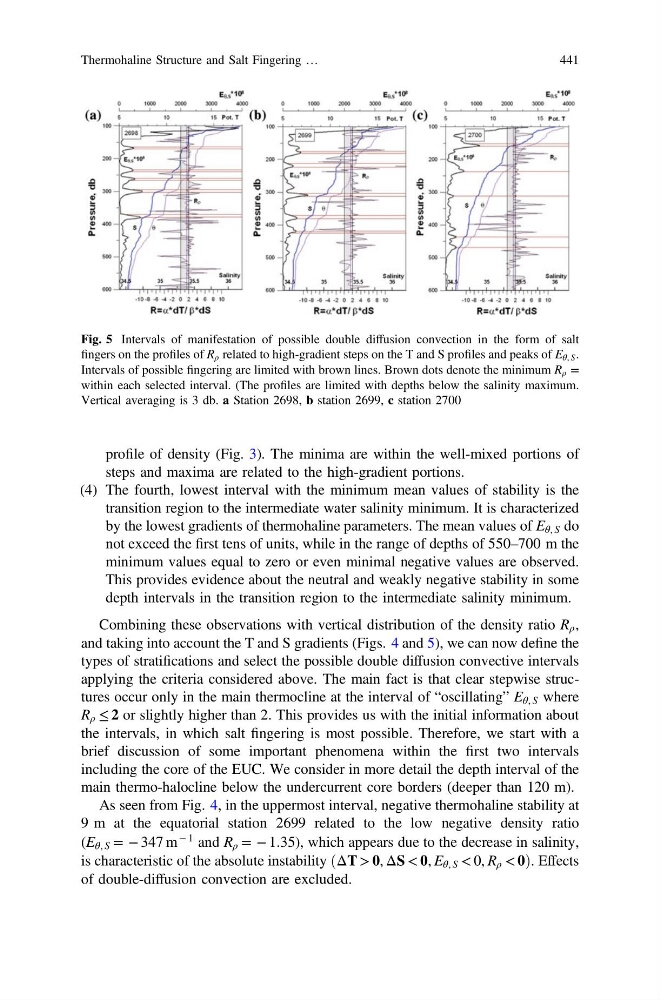
Combining these observations with vertical distribution of the density ratio R ρ ,
and taking into account the T and S gradients (Figs. 4 and 5), we can now define the
types of stratifications and select the possible double diffusion convective intervals
applying the criteria considered above. The main fact is that clear stepwise structures occur only in the main thermocline at the interval of “oscillating” E θ, S where
R ρ ≤ 2 or slightly higher than 2. This provides us with the initial information about
the intervals, in which salt fingering is most possible. Therefore, we start with a
brief discussion of some important phenomena within the first two intervals
including the core of the EUC. We consider in more detail the depth interval of the
main thermo-halocline below the undercurrent core borders (deeper than 120 m).
As seen from Fig. 4, in the uppermost interval, negative thermohaline stability at
9 m at the equatorial station 2699 related to the low negative density ratio
(E θ, S = − 347 m
− 1 and R ρ = − 1.35), which appears due to the decrease in salinity,
is characteristic of the absolute instability ðΔT > 0, ΔS < 0, E θ, S < 0, R ρ < 0Þ. Effects
of double-diffusion convection are excluded.
Fig. 5 Intervals of manifestation of possible double diffusion convection in the form of salt
fingers on the profiles of R ρ related to high-gradient steps on the T and S profiles and peaks of E θ, S .
Intervals of possible fingering are limited with brown lines. Brown dots denote the minimum R ρ =
within each selected interval. (The profiles are limited with depths below the salinity maximum.
Vertical averaging is 3 db. a Station 2698, b station 2699, c station 2700
Thermohaline Structure and Salt Fingering …
441
steps and maxima are related to the high-gradient portions.
(4) The fourth, lowest interval with the minimum mean values of stability is the
transition region to the intermediate water salinity minimum. It is characterized
by the lowest gradients of thermohaline parameters. The mean values of E θ, S do
not exceed the first tens of units, while in the range of depths of 550–700 m the
minimum values equal to zero or even minimal negative values are observed.
This provides evidence about the neutral and weakly negative stability in some
depth intervals in the transition region to the intermediate salinity minimum.
Combining these observations with vertical distribution of the density ratio R ρ ,
and taking into account the T and S gradients (Figs. 4 and 5), we can now define the
types of stratifications and select the possible double diffusion convective intervals
applying the criteria considered above. The main fact is that clear stepwise structures occur only in the main thermocline at the interval of “oscillating” E θ, S where
R ρ ≤ 2 or slightly higher than 2. This provides us with the initial information about
the intervals, in which salt fingering is most possible. Therefore, we start with a
brief discussion of some important phenomena within the first two intervals
including the core of the EUC. We consider in more detail the depth interval of the
main thermo-halocline below the undercurrent core borders (deeper than 120 m).
As seen from Fig. 4, in the uppermost interval, negative thermohaline stability at
9 m at the equatorial station 2699 related to the low negative density ratio
(E θ, S = − 347 m
− 1 and R ρ = − 1.35), which appears due to the decrease in salinity,
is characteristic of the absolute instability ðΔT > 0, ΔS < 0, E θ, S < 0, R ρ < 0Þ. Effects
of double-diffusion convection are excluded.
Fig. 5 Intervals of manifestation of possible double diffusion convection in the form of salt
fingers on the profiles of R ρ related to high-gradient steps on the T and S profiles and peaks of E θ, S .
Intervals of possible fingering are limited with brown lines. Brown dots denote the minimum R ρ =
within each selected interval. (The profiles are limited with depths below the salinity maximum.
Vertical averaging is 3 db. a Station 2698, b station 2699, c station 2700
Thermohaline Structure and Salt Fingering …
441