

a possibility to consider stepwise structures of the same vertical scale and larger,
and the profiles with such averaging have been further analyzed.
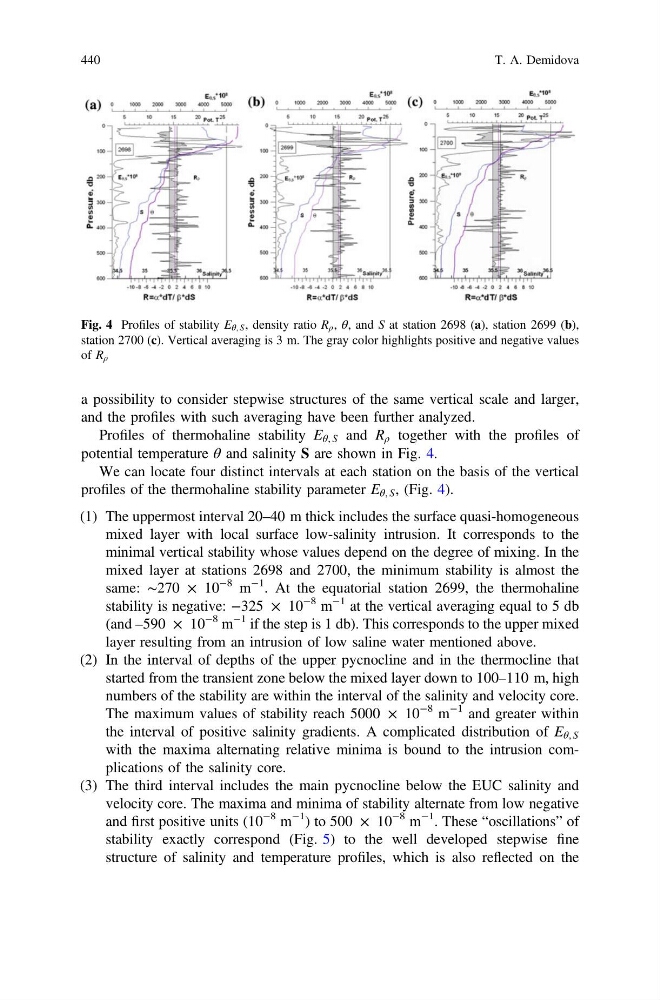
Profiles of thermohaline stability E θ, S and R ρ together with the profiles of
potential temperature θ and salinity S are shown in Fig. 4.
We can locate four distinct intervals at each station on the basis of the vertical
profiles of the thermohaline stability parameter E θ, S , (Fig. 4).
(1) The uppermost interval 20–40 m thick includes the surface quasi-homogeneous
mixed layer with local surface low-salinity intrusion. It corresponds to the
minimal vertical stability whose values depend on the degree of mixing. In the
mixed layer at stations 2698 and 2700, the minimum stability is almost the
same: ∼270 × 10
−8 m
−1
. At the equatorial station 2699, the thermohaline
stability is negative: −325 × 10
−8 m
−1 at the vertical averaging equal to 5 db
(and –590 × 10
−8 m
−1 if the step is 1 db). This corresponds to the upper mixed
layer resulting from an intrusion of low saline water mentioned above.
(2) In the interval of depths of the upper pycnocline and in the thermocline that
started from the transient zone below the mixed layer down to 100–110 m, high
numbers of the stability are within the interval of the salinity and velocity core.
The maximum values of stability reach 5000 × 10
−8 m
−1 and greater within
the interval of positive salinity gradients. A complicated distribution of E θ, S
with the maxima alternating relative minima is bound to the intrusion complications of the salinity core.
(3) The third interval includes the main pycnocline below the EUC salinity and
velocity core. The maxima and minima of stability alternate from low negative
and first positive units (10
−8 m
−1 ) to 500 × 10
−8 m
−1 . These “oscillations” of
stability exactly correspond (Fig. 5) to the well developed stepwise fine
structure of salinity and temperature profiles, which is also reflected on the
Fig. 4 Profiles of stability E θ, S , density ratio R ρ , θ, and S at station 2698 (a), station 2699 (b),
station 2700 (c). Vertical averaging is 3 m. The gray color highlights positive and negative values
of R ρ
440
T. A. Demidova
and the profiles with such averaging have been further analyzed.
Profiles of thermohaline stability E θ, S and R ρ together with the profiles of
potential temperature θ and salinity S are shown in Fig. 4.
We can locate four distinct intervals at each station on the basis of the vertical
profiles of the thermohaline stability parameter E θ, S , (Fig. 4).
(1) The uppermost interval 20–40 m thick includes the surface quasi-homogeneous
mixed layer with local surface low-salinity intrusion. It corresponds to the
minimal vertical stability whose values depend on the degree of mixing. In the
mixed layer at stations 2698 and 2700, the minimum stability is almost the
same: ∼270 × 10
−8 m
−1
. At the equatorial station 2699, the thermohaline
stability is negative: −325 × 10
−8 m
−1 at the vertical averaging equal to 5 db
(and –590 × 10
−8 m
−1 if the step is 1 db). This corresponds to the upper mixed
layer resulting from an intrusion of low saline water mentioned above.
(2) In the interval of depths of the upper pycnocline and in the thermocline that
started from the transient zone below the mixed layer down to 100–110 m, high
numbers of the stability are within the interval of the salinity and velocity core.
The maximum values of stability reach 5000 × 10
−8 m
−1 and greater within
the interval of positive salinity gradients. A complicated distribution of E θ, S
with the maxima alternating relative minima is bound to the intrusion complications of the salinity core.
(3) The third interval includes the main pycnocline below the EUC salinity and
velocity core. The maxima and minima of stability alternate from low negative
and first positive units (10
−8 m
−1 ) to 500 × 10
−8 m
−1 . These “oscillations” of
stability exactly correspond (Fig. 5) to the well developed stepwise fine
structure of salinity and temperature profiles, which is also reflected on the
Fig. 4 Profiles of stability E θ, S , density ratio R ρ , θ, and S at station 2698 (a), station 2699 (b),
station 2700 (c). Vertical averaging is 3 m. The gray color highlights positive and negative values
of R ρ
440
T. A. Demidova