

Mean State of the Full-Depth Circulation in the 2000s
The mean state of the full-depth summer circulation in the Atlantic Ocean in the
region in between Cape Farewell (Greenland), Scotland and the Greenland-Scotland
Ridge (Fig. 1) was assessed by combining 2002–2008 yearly hydrographic measurements at 59.5° N, mean dynamic topography, satellite altimetry data, and
available estimates of the Atlantic–Nordic Seas exchange [8]. The mean absolute
transports by the upper-ocean, mid-depth and deep currents and the MOC
(MOCσ = 16.5 ± 2.2 Sv, at σ 0 = 27.55) at 59.5° N were quantified in the density
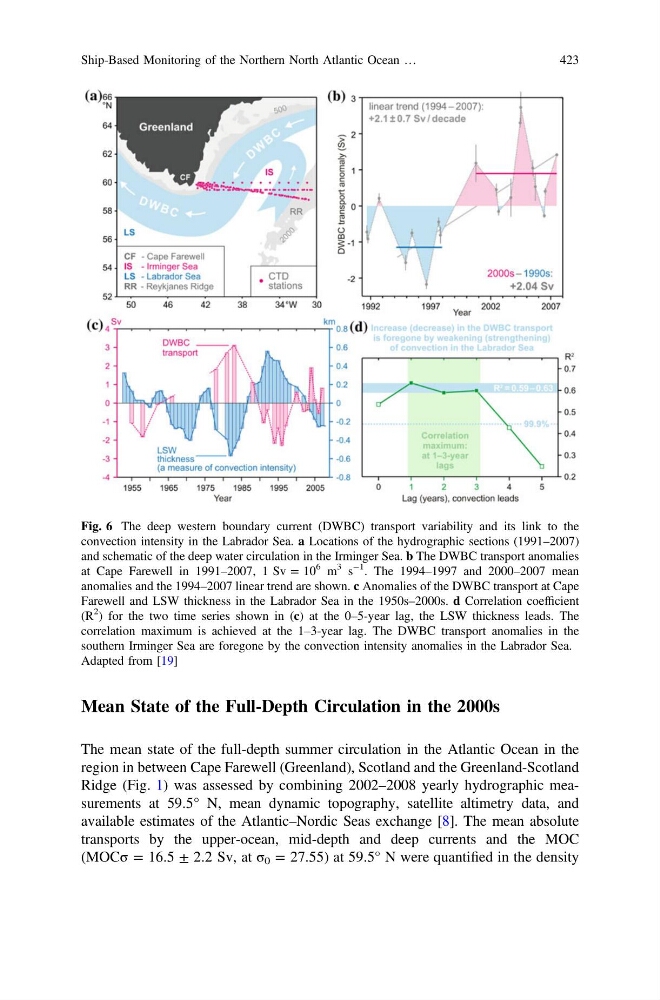
Fig. 6 The deep western boundary current (DWBC) transport variability and its link to the
convection intensity in the Labrador Sea. a Locations of the hydrographic sections (1991–2007)
and schematic of the deep water circulation in the Irminger Sea. b The DWBC transport anomalies
at Cape Farewell in 1991–2007, 1 Sv = 10
6 m
3 s
−1
. The 1994–1997 and 2000–2007 mean
anomalies and the 1994–2007 linear trend are shown. c Anomalies of the DWBC transport at Cape
Farewell and LSW thickness in the Labrador Sea in the 1950s–2000s. d Correlation coefficient
(R
2
) for the two time series shown in (c) at the 0–5-year lag, the LSW thickness leads. The
correlation maximum is achieved at the 1–3-year lag. The DWBC transport anomalies in the
southern Irminger Sea are foregone by the convection intensity anomalies in the Labrador Sea.
Adapted from [19]
Ship-Based Monitoring of the Northern North Atlantic Ocean …
423
The mean state of the full-depth summer circulation in the Atlantic Ocean in the
region in between Cape Farewell (Greenland), Scotland and the Greenland-Scotland
Ridge (Fig. 1) was assessed by combining 2002–2008 yearly hydrographic measurements at 59.5° N, mean dynamic topography, satellite altimetry data, and
available estimates of the Atlantic–Nordic Seas exchange [8]. The mean absolute
transports by the upper-ocean, mid-depth and deep currents and the MOC
(MOCσ = 16.5 ± 2.2 Sv, at σ 0 = 27.55) at 59.5° N were quantified in the density
Fig. 6 The deep western boundary current (DWBC) transport variability and its link to the
convection intensity in the Labrador Sea. a Locations of the hydrographic sections (1991–2007)
and schematic of the deep water circulation in the Irminger Sea. b The DWBC transport anomalies
at Cape Farewell in 1991–2007, 1 Sv = 10
6 m
3 s
−1
. The 1994–1997 and 2000–2007 mean
anomalies and the 1994–2007 linear trend are shown. c Anomalies of the DWBC transport at Cape
Farewell and LSW thickness in the Labrador Sea in the 1950s–2000s. d Correlation coefficient
(R
2
) for the two time series shown in (c) at the 0–5-year lag, the LSW thickness leads. The
correlation maximum is achieved at the 1–3-year lag. The DWBC transport anomalies in the
southern Irminger Sea are foregone by the convection intensity anomalies in the Labrador Sea.
Adapted from [19]
Ship-Based Monitoring of the Northern North Atlantic Ocean …
423