

Deep-Ocean Salinity Changes and Climate Change
There are increasing concerns that in the warmer climate, the MOC may substantially decline due to a decrease in the convective activity in the northern North
Atlantic and Nordic Seas (e.g., [26]). The long-term freshening in the Nordic Seas
and freshening of the northern North Atlantic deep waters in the 1960s–1990s have
been considered as a likely indicator or precursor of the dramatic change in the
MOC (e.g., [11]). The freshening has been attributed to a combination of factors
potentially associated with the global warming: the increasing ice melt and net
precipitation at high latitudes (e.g., [10]). A probable causality between the climate
change and the decreasing North Atlantic deep water salinity has supported the
concerns and unfavorable predictions, thus ‘warming up’ the reasonable scientific
debate on climate change and overblown speculations in media.
Despite the long-term increase in freshwater input to the Arctic, freshening in the
northern North Atlantic had reversed in the mid-1990s, as we demonstrated above.
This reversal forces us to revise the hypotheses on the mechanisms behind the
deep-water thermohaline anomalies. It seems doubtful that the persistent global
temperature growth may lead to the opposite decadal trends (positive-then-negativethen-positive, Fig. 4) in the deep water salinity.
Our results [16–18] suggest that natural atmospheric variability over the North
Atlantic plays the major role in the deep-water thermohaline variability on a decadal
time scale. There are no reasons to associate the deep-water freshening in the
1960s–1990s with climate change, unless the 3-decade-long surface forcing
amplification is evidently shown to be a consequence of the latter. Having said that,
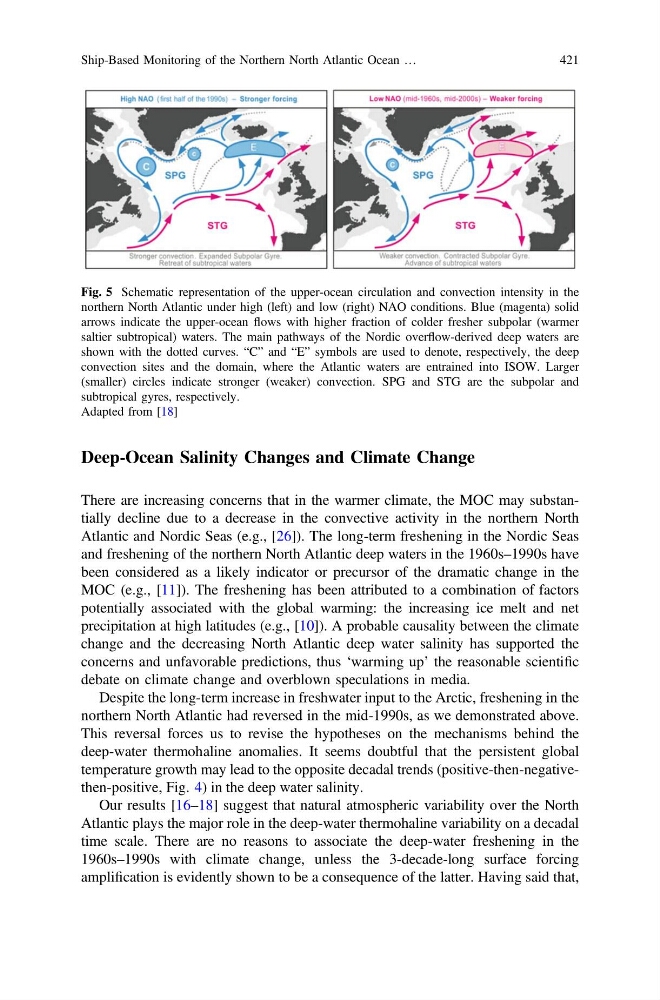
Fig. 5 Schematic representation of the upper-ocean circulation and convection intensity in the
northern North Atlantic under high (left) and low (right) NAO conditions. Blue (magenta) solid
arrows indicate the upper-ocean flows with higher fraction of colder fresher subpolar (warmer
saltier subtropical) waters. The main pathways of the Nordic overflow-derived deep waters are
shown with the dotted curves. “C” and “E” symbols are used to denote, respectively, the deep
convection sites and the domain, where the Atlantic waters are entrained into ISOW. Larger
(smaller) circles indicate stronger (weaker) convection. SPG and STG are the subpolar and
subtropical gyres, respectively.
Adapted from [18]
Ship-Based Monitoring of the Northern North Atlantic Ocean …
421
There are increasing concerns that in the warmer climate, the MOC may substantially decline due to a decrease in the convective activity in the northern North
Atlantic and Nordic Seas (e.g., [26]). The long-term freshening in the Nordic Seas
and freshening of the northern North Atlantic deep waters in the 1960s–1990s have
been considered as a likely indicator or precursor of the dramatic change in the
MOC (e.g., [11]). The freshening has been attributed to a combination of factors
potentially associated with the global warming: the increasing ice melt and net
precipitation at high latitudes (e.g., [10]). A probable causality between the climate
change and the decreasing North Atlantic deep water salinity has supported the
concerns and unfavorable predictions, thus ‘warming up’ the reasonable scientific
debate on climate change and overblown speculations in media.
Despite the long-term increase in freshwater input to the Arctic, freshening in the
northern North Atlantic had reversed in the mid-1990s, as we demonstrated above.
This reversal forces us to revise the hypotheses on the mechanisms behind the
deep-water thermohaline anomalies. It seems doubtful that the persistent global
temperature growth may lead to the opposite decadal trends (positive-then-negativethen-positive, Fig. 4) in the deep water salinity.
Our results [16–18] suggest that natural atmospheric variability over the North
Atlantic plays the major role in the deep-water thermohaline variability on a decadal
time scale. There are no reasons to associate the deep-water freshening in the
1960s–1990s with climate change, unless the 3-decade-long surface forcing
amplification is evidently shown to be a consequence of the latter. Having said that,
Fig. 5 Schematic representation of the upper-ocean circulation and convection intensity in the
northern North Atlantic under high (left) and low (right) NAO conditions. Blue (magenta) solid
arrows indicate the upper-ocean flows with higher fraction of colder fresher subpolar (warmer
saltier subtropical) waters. The main pathways of the Nordic overflow-derived deep waters are
shown with the dotted curves. “C” and “E” symbols are used to denote, respectively, the deep
convection sites and the domain, where the Atlantic waters are entrained into ISOW. Larger
(smaller) circles indicate stronger (weaker) convection. SPG and STG are the subpolar and
subtropical gyres, respectively.
Adapted from [18]
Ship-Based Monitoring of the Northern North Atlantic Ocean …
421