

contributing to cooling and freshening at the intermediate (LSW) levels. The two
regimes of convection and large-scale circulation corresponding to stronger (early
1990s) and weaker (mid-1960s, mid-2000s) NAO-related atmospheric forcing are
schematically visualized in Fig. 5.
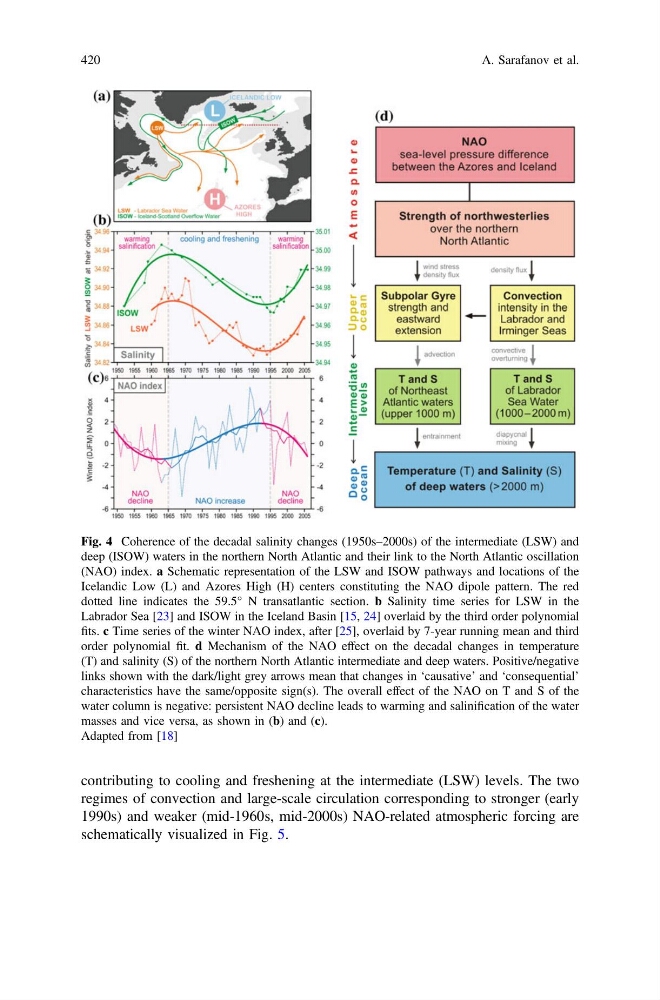
Fig. 4 Coherence of the decadal salinity changes (1950s–2000s) of the intermediate (LSW) and
deep (ISOW) waters in the northern North Atlantic and their link to the North Atlantic oscillation
(NAO) index. a Schematic representation of the LSW and ISOW pathways and locations of the
Icelandic Low (L) and Azores High (H) centers constituting the NAO dipole pattern. The red
dotted line indicates the 59.5° N transatlantic section. b Salinity time series for LSW in the
Labrador Sea [23] and ISOW in the Iceland Basin [15, 24] overlaid by the third order polynomial
fits. c Time series of the winter NAO index, after [25], overlaid by 7-year running mean and third
order polynomial fit. d Mechanism of the NAO effect on the decadal changes in temperature
(T) and salinity (S) of the northern North Atlantic intermediate and deep waters. Positive/negative
links shown with the dark/light grey arrows mean that changes in ‘causative’ and ‘consequential’
characteristics have the same/opposite sign(s). The overall effect of the NAO on T and S of the
water column is negative: persistent NAO decline leads to warming and salinification of the water
masses and vice versa, as shown in (b) and (c).
Adapted from [18]
420
A. Sarafanov et al.
regimes of convection and large-scale circulation corresponding to stronger (early
1990s) and weaker (mid-1960s, mid-2000s) NAO-related atmospheric forcing are
schematically visualized in Fig. 5.
Fig. 4 Coherence of the decadal salinity changes (1950s–2000s) of the intermediate (LSW) and
deep (ISOW) waters in the northern North Atlantic and their link to the North Atlantic oscillation
(NAO) index. a Schematic representation of the LSW and ISOW pathways and locations of the
Icelandic Low (L) and Azores High (H) centers constituting the NAO dipole pattern. The red
dotted line indicates the 59.5° N transatlantic section. b Salinity time series for LSW in the
Labrador Sea [23] and ISOW in the Iceland Basin [15, 24] overlaid by the third order polynomial
fits. c Time series of the winter NAO index, after [25], overlaid by 7-year running mean and third
order polynomial fit. d Mechanism of the NAO effect on the decadal changes in temperature
(T) and salinity (S) of the northern North Atlantic intermediate and deep waters. Positive/negative
links shown with the dark/light grey arrows mean that changes in ‘causative’ and ‘consequential’
characteristics have the same/opposite sign(s). The overall effect of the NAO on T and S of the
water column is negative: persistent NAO decline leads to warming and salinification of the water
masses and vice versa, as shown in (b) and (c).
Adapted from [18]
420
A. Sarafanov et al.