

pressure anomalies corresponding to the inter-decadal GAO is apparently quite
stable, perhaps on the scale of a few decades.
As a preliminary study, the main elements of the interannual GAO may be
considered timely in conjunction with the well defined phases of the ENSO variability, for which the GAO is the background or the primary process, as it has been
already mentioned. In other words, in such cases it is appropriate to use the
common ENSO (El Niño and La Niña) indices as the markers of the GAO. Further,
by the analogy with the various regional oscillations, which are identified by their
conventional indices, an appropriate index for the GAO that assesses the characteristic deformation of the planetary atmospheric pressure fields in the
equatorial-tropical region (30° S–30° N, 60° W–180°) could be described by the
formula:
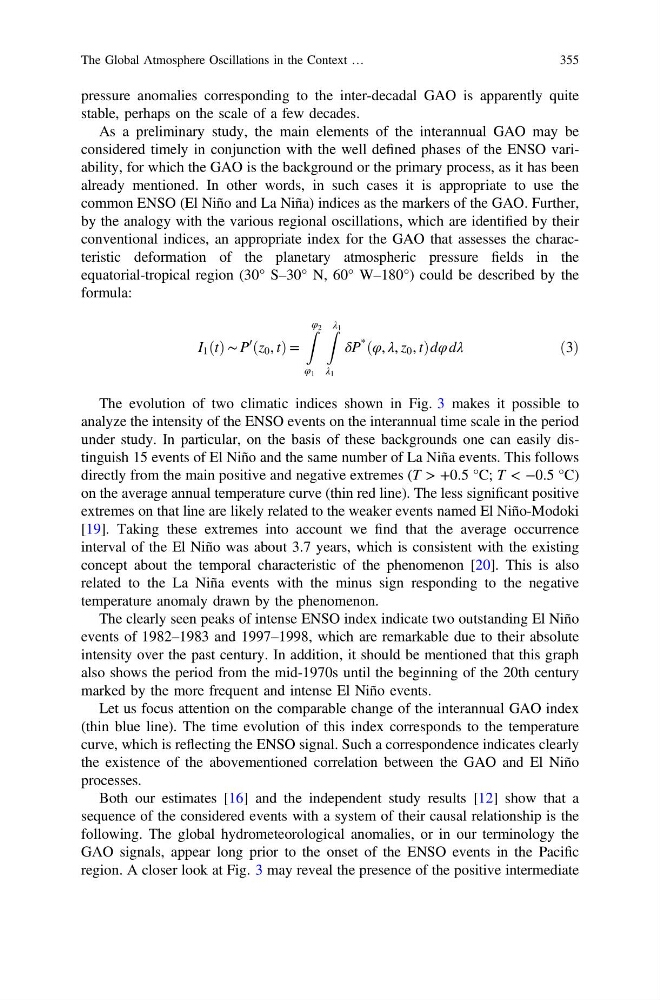
I 1 t
ð Þ ∼ P
0
ðz 0 , tÞ =
Z φ 2
φ 1
Z λ 1
λ 1
δP
*
ðφ, λ, z 0 , tÞdφ dλ
ð3Þ
The evolution of two climatic indices shown in Fig. 3 makes it possible to
analyze the intensity of the ENSO events on the interannual time scale in the period
under study. In particular, on the basis of these backgrounds one can easily distinguish 15 events of El Niño and the same number of La Niña events. This follows
directly from the main positive and negative extremes (T > +0.5 °C; T < −0.5 °C)
on the average annual temperature curve (thin red line). The less significant positive
extremes on that line are likely related to the weaker events named El Niño-Modoki
[19]. Taking these extremes into account we find that the average occurrence
interval of the El Niño was about 3.7 years, which is consistent with the existing
concept about the temporal characteristic of the phenomenon [20]. This is also
related to the La Niña events with the minus sign responding to the negative
temperature anomaly drawn by the phenomenon.
The clearly seen peaks of intense ENSO index indicate two outstanding El Niño
events of 1982–1983 and 1997–1998, which are remarkable due to their absolute
intensity over the past century. In addition, it should be mentioned that this graph
also shows the period from the mid-1970s until the beginning of the 20th century
marked by the more frequent and intense El Niño events.
Let us focus attention on the comparable change of the interannual GAO index
(thin blue line). The time evolution of this index corresponds to the temperature
curve, which is reflecting the ENSO signal. Such a correspondence indicates clearly
the existence of the abovementioned correlation between the GAO and El Niño
processes.
Both our estimates [16] and the independent study results [12] show that a
sequence of the considered events with a system of their causal relationship is the
following. The global hydrometeorological anomalies, or in our terminology the
GAO signals, appear long prior to the onset of the ENSO events in the Pacific
region. A closer look at Fig. 3 may reveal the presence of the positive intermediate
The Global Atmosphere Oscillations in the Context …
355
stable, perhaps on the scale of a few decades.
As a preliminary study, the main elements of the interannual GAO may be
considered timely in conjunction with the well defined phases of the ENSO variability, for which the GAO is the background or the primary process, as it has been
already mentioned. In other words, in such cases it is appropriate to use the
common ENSO (El Niño and La Niña) indices as the markers of the GAO. Further,
by the analogy with the various regional oscillations, which are identified by their
conventional indices, an appropriate index for the GAO that assesses the characteristic deformation of the planetary atmospheric pressure fields in the
equatorial-tropical region (30° S–30° N, 60° W–180°) could be described by the
formula:
I 1 t
ð Þ ∼ P
0
ðz 0 , tÞ =
Z φ 2
φ 1
Z λ 1
λ 1
δP
*
ðφ, λ, z 0 , tÞdφ dλ
ð3Þ
The evolution of two climatic indices shown in Fig. 3 makes it possible to
analyze the intensity of the ENSO events on the interannual time scale in the period
under study. In particular, on the basis of these backgrounds one can easily distinguish 15 events of El Niño and the same number of La Niña events. This follows
directly from the main positive and negative extremes (T > +0.5 °C; T < −0.5 °C)
on the average annual temperature curve (thin red line). The less significant positive
extremes on that line are likely related to the weaker events named El Niño-Modoki
[19]. Taking these extremes into account we find that the average occurrence
interval of the El Niño was about 3.7 years, which is consistent with the existing
concept about the temporal characteristic of the phenomenon [20]. This is also
related to the La Niña events with the minus sign responding to the negative
temperature anomaly drawn by the phenomenon.
The clearly seen peaks of intense ENSO index indicate two outstanding El Niño
events of 1982–1983 and 1997–1998, which are remarkable due to their absolute
intensity over the past century. In addition, it should be mentioned that this graph
also shows the period from the mid-1970s until the beginning of the 20th century
marked by the more frequent and intense El Niño events.
Let us focus attention on the comparable change of the interannual GAO index
(thin blue line). The time evolution of this index corresponds to the temperature
curve, which is reflecting the ENSO signal. Such a correspondence indicates clearly
the existence of the abovementioned correlation between the GAO and El Niño
processes.
Both our estimates [16] and the independent study results [12] show that a
sequence of the considered events with a system of their causal relationship is the
following. The global hydrometeorological anomalies, or in our terminology the
GAO signals, appear long prior to the onset of the ENSO events in the Pacific
region. A closer look at Fig. 3 may reveal the presence of the positive intermediate
The Global Atmosphere Oscillations in the Context …
355