

Discussion
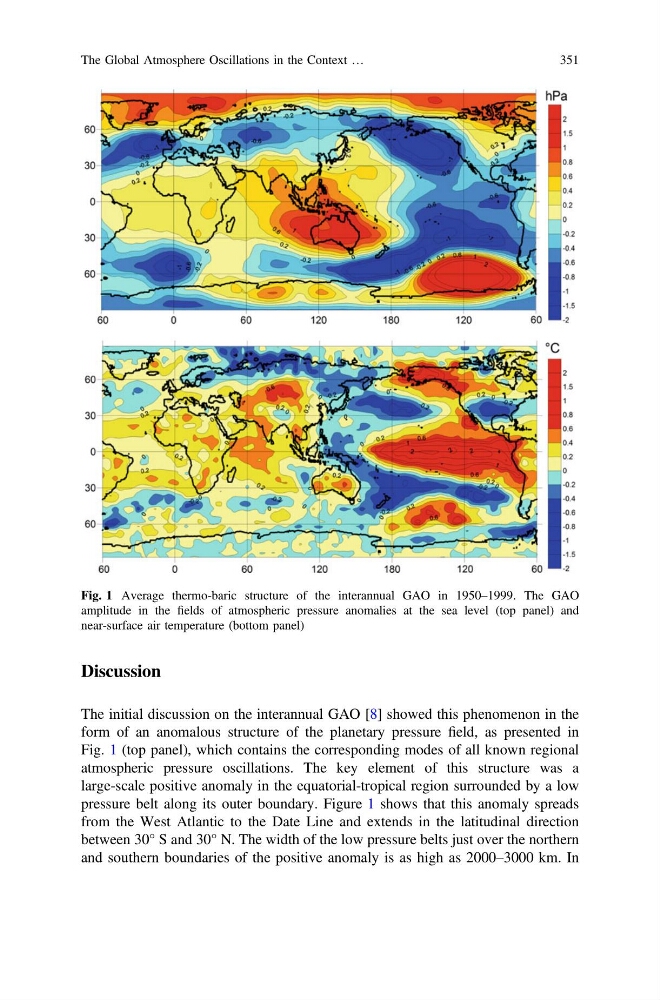
The initial discussion on the interannual GAO [8] showed this phenomenon in the
form of an anomalous structure of the planetary pressure field, as presented in
Fig. 1 (top panel), which contains the corresponding modes of all known regional
atmospheric pressure oscillations. The key element of this structure was a
large-scale positive anomaly in the equatorial-tropical region surrounded by a low
pressure belt along its outer boundary. Figure 1 shows that this anomaly spreads
from the West Atlantic to the Date Line and extends in the latitudinal direction
between 30° S and 30° N. The width of the low pressure belts just over the northern
and southern boundaries of the positive anomaly is as high as 2000–3000 km. In
Fig. 1 Average thermo-baric structure of the interannual GAO in 1950–1999. The GAO
amplitude in the fields of atmospheric pressure anomalies at the sea level (top panel) and
near-surface air temperature (bottom panel)
The Global Atmosphere Oscillations in the Context …
351
The initial discussion on the interannual GAO [8] showed this phenomenon in the
form of an anomalous structure of the planetary pressure field, as presented in
Fig. 1 (top panel), which contains the corresponding modes of all known regional
atmospheric pressure oscillations. The key element of this structure was a
large-scale positive anomaly in the equatorial-tropical region surrounded by a low
pressure belt along its outer boundary. Figure 1 shows that this anomaly spreads
from the West Atlantic to the Date Line and extends in the latitudinal direction
between 30° S and 30° N. The width of the low pressure belts just over the northern
and southern boundaries of the positive anomaly is as high as 2000–3000 km. In
Fig. 1 Average thermo-baric structure of the interannual GAO in 1950–1999. The GAO
amplitude in the fields of atmospheric pressure anomalies at the sea level (top panel) and
near-surface air temperature (bottom panel)
The Global Atmosphere Oscillations in the Context …
351