

Abyssal Mixing in the Laboratory
231
5
10
15
20
25
30
35
40
5
10
15
20
25
0
0.25
0.5
0.75
1
1.25
1.5
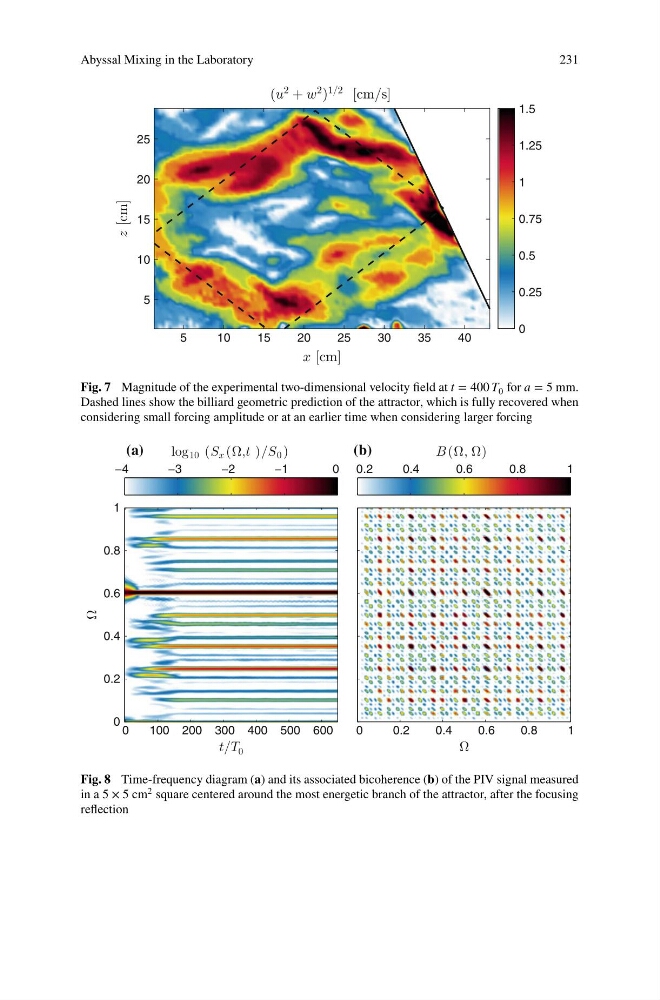
Fig. 7 Magnitude of the experimental two-dimensional velocity field at t = 400 T 0 for a = 5 mm.
Dashed lines show the billiard geometric prediction of the attractor, which is fully recovered when
considering small forcing amplitude or at an earlier time when considering larger forcing
t/T 0
Ω
0
100 200 300 400 500 600
0
0.2
0.4
0.6
0.8
1
−4
−3
−2
−1
0
Ω
0
0.2
0.4
0.6
0.8
1
0.2
0.4
0.6
0.8
1
log 10 (S x (Ω,t )/S 0 )
B (Ω, Ω)
(a)
(b)
Fig. 8 Time-frequency diagram (a) and its associated bicoherence (b) of the PIV signal measured
in a 5 × 5 cm 2 square centered around the most energetic branch of the attractor, after the focusing
reflection
231
5
10
15
20
25
30
35
40
5
10
15
20
25
0
0.25
0.5
0.75
1
1.25
1.5
Fig. 7 Magnitude of the experimental two-dimensional velocity field at t = 400 T 0 for a = 5 mm.
Dashed lines show the billiard geometric prediction of the attractor, which is fully recovered when
considering small forcing amplitude or at an earlier time when considering larger forcing
t/T 0
Ω
0
100 200 300 400 500 600
0
0.2
0.4
0.6
0.8
1
−4
−3
−2
−1
0
Ω
0
0.2
0.4
0.6
0.8
1
0.2
0.4
0.6
0.8
1
log 10 (S x (Ω,t )/S 0 )
B (Ω, Ω)
(a)
(b)
Fig. 8 Time-frequency diagram (a) and its associated bicoherence (b) of the PIV signal measured
in a 5 × 5 cm 2 square centered around the most energetic branch of the attractor, after the focusing
reflection