

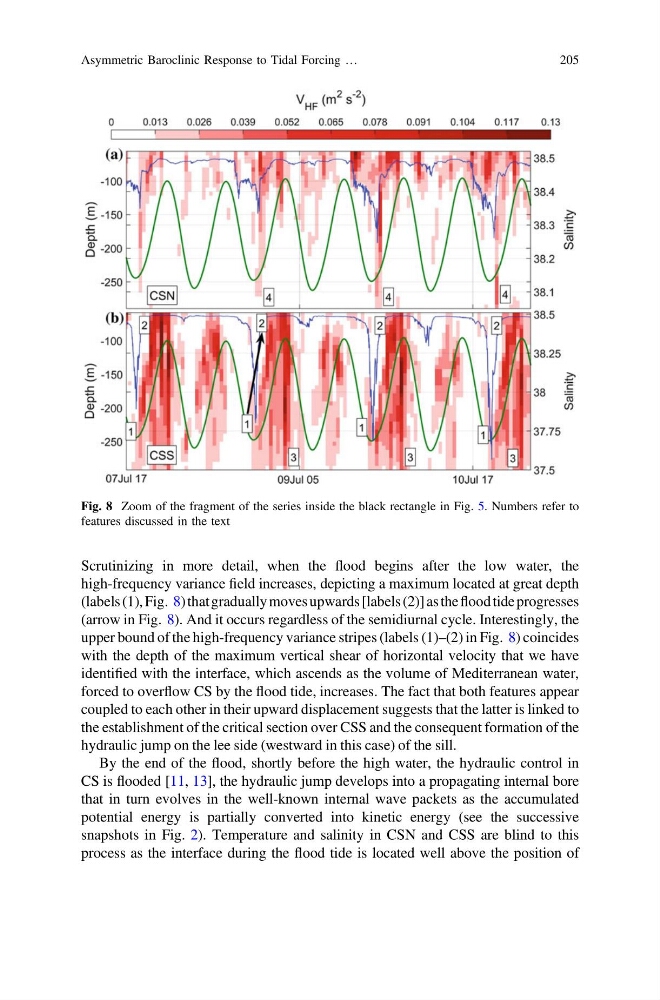
Scrutinizing in more detail, when the flood begins after the low water, the
high-frequency variance field increases, depicting a maximum located at great depth
(labels (1), Fig. 8) that gradually moves upwards [labels (2)] as the flood tide progresses
(arrow in Fig. 8). And it occurs regardless of the semidiurnal cycle. Interestingly, the
upper bound of the high-frequency variance stripes (labels (1)–(2) in Fig. 8) coincides
with the depth of the maximum vertical shear of horizontal velocity that we have
identified with the interface, which ascends as the volume of Mediterranean water,
forced to overflow CS by the flood tide, increases. The fact that both features appear
coupled to each other in their upward displacement suggests that the latter is linked to
the establishment of the critical section over CSS and the consequent formation of the
hydraulic jump on the lee side (westward in this case) of the sill.
By the end of the flood, shortly before the high water, the hydraulic control in
CS is flooded [11, 13], the hydraulic jump develops into a propagating internal bore
that in turn evolves in the well-known internal wave packets as the accumulated
potential energy is partially converted into kinetic energy (see the successive
snapshots in Fig. 2). Temperature and salinity in CSN and CSS are blind to this
process as the interface during the flood tide is located well above the position of
Fig. 8 Zoom of the fragment of the series inside the black rectangle in Fig. 5. Numbers refer to
features discussed in the text
Asymmetric Baroclinic Response to Tidal Forcing …
205
high-frequency variance field increases, depicting a maximum located at great depth
(labels (1), Fig. 8) that gradually moves upwards [labels (2)] as the flood tide progresses
(arrow in Fig. 8). And it occurs regardless of the semidiurnal cycle. Interestingly, the
upper bound of the high-frequency variance stripes (labels (1)–(2) in Fig. 8) coincides
with the depth of the maximum vertical shear of horizontal velocity that we have
identified with the interface, which ascends as the volume of Mediterranean water,
forced to overflow CS by the flood tide, increases. The fact that both features appear
coupled to each other in their upward displacement suggests that the latter is linked to
the establishment of the critical section over CSS and the consequent formation of the
hydraulic jump on the lee side (westward in this case) of the sill.
By the end of the flood, shortly before the high water, the hydraulic control in
CS is flooded [11, 13], the hydraulic jump develops into a propagating internal bore
that in turn evolves in the well-known internal wave packets as the accumulated
potential energy is partially converted into kinetic energy (see the successive
snapshots in Fig. 2). Temperature and salinity in CSN and CSS are blind to this
process as the interface during the flood tide is located well above the position of
Fig. 8 Zoom of the fragment of the series inside the black rectangle in Fig. 5. Numbers refer to
features discussed in the text
Asymmetric Baroclinic Response to Tidal Forcing …
205