

Deep-Ocean Tides in the South-West Indian Ocean . . .
171
(a)
(b)
(d)
(c)
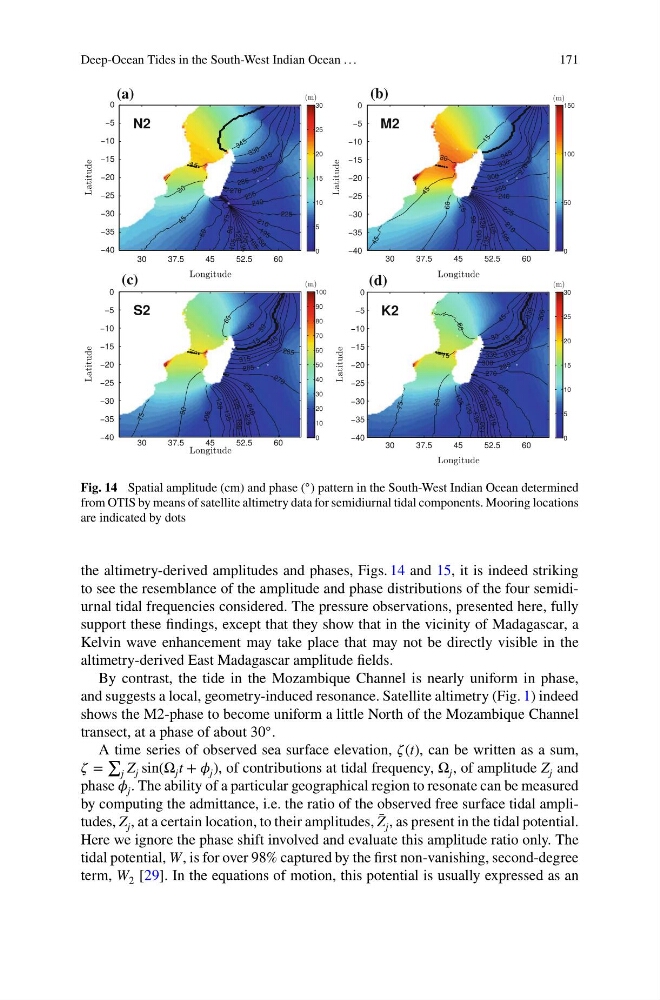
Fig. 14 Spatial amplitude (cm) and phase (
◦ ) pattern in the South-West Indian Ocean determined
from OTIS by means of satellite altimetry data for semidiurnal tidal components. Mooring locations
are indicated by dots
the altimetry-derived amplitudes and phases, Figs. 14 and 15, it is indeed striking
to see the resemblance of the amplitude and phase distributions of the four semidiurnal tidal frequencies considered. The pressure observations, presented here, fully
support these findings, except that they show that in the vicinity of Madagascar, a
Kelvin wave enhancement may take place that may not be directly visible in the
altimetry-derived East Madagascar amplitude fields.
By contrast, the tide in the Mozambique Channel is nearly uniform in phase,
and suggests a local, geometry-induced resonance. Satellite altimetry (Fig. 1) indeed
shows the M2-phase to become uniform a little North of the Mozambique Channel
transect, at a phase of about 30
◦ .
A time series of observed sea surface elevation, í µí¼ (t), can be written as a sum,
í µí¼ =
∑
j Z j sin(Ω j t + í µí¼ j ), of contributions at tidal frequency, Ω j , of amplitude Z j and
phase í µí¼ j . The ability of a particular geographical region to resonate can be measured
by computing the admittance, i.e. the ratio of the observed free surface tidal amplitudes, Z j , at a certain location, to their amplitudes, ̄
Z j , as present in the tidal potential.
Here we ignore the phase shift involved and evaluate this amplitude ratio only. The
tidal potential, W, is for over 98% captured by the first non-vanishing, second-degree
term, W 2 [29]. In the equations of motion, this potential is usually expressed as an
171
(a)
(b)
(d)
(c)
Fig. 14 Spatial amplitude (cm) and phase (
◦ ) pattern in the South-West Indian Ocean determined
from OTIS by means of satellite altimetry data for semidiurnal tidal components. Mooring locations
are indicated by dots
the altimetry-derived amplitudes and phases, Figs. 14 and 15, it is indeed striking
to see the resemblance of the amplitude and phase distributions of the four semidiurnal tidal frequencies considered. The pressure observations, presented here, fully
support these findings, except that they show that in the vicinity of Madagascar, a
Kelvin wave enhancement may take place that may not be directly visible in the
altimetry-derived East Madagascar amplitude fields.
By contrast, the tide in the Mozambique Channel is nearly uniform in phase,
and suggests a local, geometry-induced resonance. Satellite altimetry (Fig. 1) indeed
shows the M2-phase to become uniform a little North of the Mozambique Channel
transect, at a phase of about 30
◦ .
A time series of observed sea surface elevation, í µí¼ (t), can be written as a sum,
í µí¼ =
∑
j Z j sin(Ω j t + í µí¼ j ), of contributions at tidal frequency, Ω j , of amplitude Z j and
phase í µí¼ j . The ability of a particular geographical region to resonate can be measured
by computing the admittance, i.e. the ratio of the observed free surface tidal amplitudes, Z j , at a certain location, to their amplitudes, ̄
Z j , as present in the tidal potential.
Here we ignore the phase shift involved and evaluate this amplitude ratio only. The
tidal potential, W, is for over 98% captured by the first non-vanishing, second-degree
term, W 2 [29]. In the equations of motion, this potential is usually expressed as an