

Deep-Ocean Tides in the South-West Indian Ocean . . .
155
02/08 03/08 04/08 05/08 06/08 07/08 08/08 09/08 10/08 11/08 12/08 01/09 02/09 03/09 04/09 05/09 06/09 07/09 08/09 09/09 10/09 11/09 12/09
−30
−20
−10
0
10
Displ. (m)
lmc 5–617m (1375 mab)
LOCO 4
02/08 03/08 04/08 05/08 06/08 07/08 08/08 09/08 10/08 11/08 12/08 01/09 02/09 03/09 04/09 05/09 06/09 07/09 08/09 09/09 10/09 11/09 12/09
−30
−20
−10
0
10
Displ. (m)
lmc 5–1020m (972 mab)
LOCO 4
02/08 03/08 04/08 05/08 06/08 07/08 08/08 09/08 10/08 11/08 12/08 01/09 02/09 03/09 04/09 05/09 06/09 07/09 08/09 09/09 10/09 11/09 12/09
−30
−20
−10
0
10
Displ. (m)
lmc 5–1520m (472 mab)
LOCO 4
02/08 03/08 04/08 05/08 06/08 07/08 08/08 09/08 10/08 11/08 12/08 01/09 02/09 03/09 04/09 05/09 06/09 07/09 08/09 09/09 10/09 11/09 12/09
−6
−4
−2
0
2
4
6
Displ. (m)
lmc 5–1966m (26 mab)
LOCO 4
02/08 03/08 04/08 05/08 06/08 07/08 08/08 09/08 10/08 11/08 12/08 01/09 02/09 03/09 04/09 05/09 06/09 07/09 08/09 09/09 10/09 11/09 12/09
−6
−4
−2
0
2
4
6
Displ. (m)
lmc 5a–2375m (27 mab)
LOCO 4
02/08 03/08 04/08 05/08 06/08 07/08 08/08 09/08 10/08 11/08 12/08 01/09 02/09 03/09 04/09 05/09 06/09 07/09 08/09 09/09 10/09 11/09 12/09
−6
−4
−2
0
2
4
6
Displ. (m)
lmc 8–625m (1574 mab)
LOCO 4
−6
−4
−2
0
2
4
6
Displ. (m)
lmc 8–1025m (1174 mab)
LOCO 4
02/08 03/08 04/08 05/08 06/08 07/08 08/08 09/08 10/08 11/08 12/08 01/09 02/09 03/09 04/09 05/09 06/09 07/09 08/09 09/09 10/09 11/09 12/09
(a)
(b)
(c)
(d)
(e)
(f)
(g)
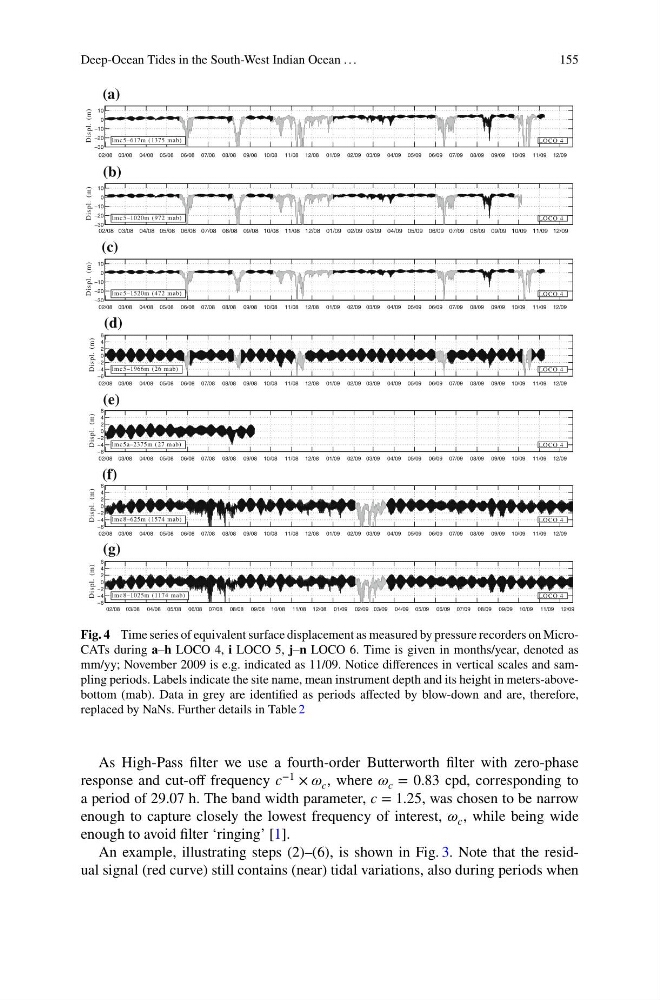
Fig. 4 Time series of equivalent surface displacement as measured by pressure recorders on MicroCATs during a–h LOCO 4, i LOCO 5, j–n LOCO 6. Time is given in months/year, denoted as
mm/yy; November 2009 is e.g. indicated as 11/09. Notice differences in vertical scales and sampling periods. Labels indicate the site name, mean instrument depth and its height in meters-abovebottom (mab). Data in grey are identified as periods affected by blow-down and are, therefore,
replaced by NaNs. Further details in Table 2
As High-Pass filter we use a fourth-order Butterworth filter with zero-phase
response and cut-off frequency c −1 × í µí¼ c , where í µí¼ c = 0.83 cpd, corresponding to
a period of 29.07 h. The band width parameter, c = 1.25, was chosen to be narrow
enough to capture closely the lowest frequency of interest, í µí¼ c , while being wide
enough to avoid filter ‘ringing’ [1].
An example, illustrating steps (2)–(6), is shown in Fig. 3. Note that the residual signal (red curve) still contains (near) tidal variations, also during periods when
155
02/08 03/08 04/08 05/08 06/08 07/08 08/08 09/08 10/08 11/08 12/08 01/09 02/09 03/09 04/09 05/09 06/09 07/09 08/09 09/09 10/09 11/09 12/09
−30
−20
−10
0
10
Displ. (m)
lmc 5–617m (1375 mab)
LOCO 4
02/08 03/08 04/08 05/08 06/08 07/08 08/08 09/08 10/08 11/08 12/08 01/09 02/09 03/09 04/09 05/09 06/09 07/09 08/09 09/09 10/09 11/09 12/09
−30
−20
−10
0
10
Displ. (m)
lmc 5–1020m (972 mab)
LOCO 4
02/08 03/08 04/08 05/08 06/08 07/08 08/08 09/08 10/08 11/08 12/08 01/09 02/09 03/09 04/09 05/09 06/09 07/09 08/09 09/09 10/09 11/09 12/09
−30
−20
−10
0
10
Displ. (m)
lmc 5–1520m (472 mab)
LOCO 4
02/08 03/08 04/08 05/08 06/08 07/08 08/08 09/08 10/08 11/08 12/08 01/09 02/09 03/09 04/09 05/09 06/09 07/09 08/09 09/09 10/09 11/09 12/09
−6
−4
−2
0
2
4
6
Displ. (m)
lmc 5–1966m (26 mab)
LOCO 4
02/08 03/08 04/08 05/08 06/08 07/08 08/08 09/08 10/08 11/08 12/08 01/09 02/09 03/09 04/09 05/09 06/09 07/09 08/09 09/09 10/09 11/09 12/09
−6
−4
−2
0
2
4
6
Displ. (m)
lmc 5a–2375m (27 mab)
LOCO 4
02/08 03/08 04/08 05/08 06/08 07/08 08/08 09/08 10/08 11/08 12/08 01/09 02/09 03/09 04/09 05/09 06/09 07/09 08/09 09/09 10/09 11/09 12/09
−6
−4
−2
0
2
4
6
Displ. (m)
lmc 8–625m (1574 mab)
LOCO 4
−6
−4
−2
0
2
4
6
Displ. (m)
lmc 8–1025m (1174 mab)
LOCO 4
02/08 03/08 04/08 05/08 06/08 07/08 08/08 09/08 10/08 11/08 12/08 01/09 02/09 03/09 04/09 05/09 06/09 07/09 08/09 09/09 10/09 11/09 12/09
(a)
(b)
(c)
(d)
(e)
(f)
(g)
Fig. 4 Time series of equivalent surface displacement as measured by pressure recorders on MicroCATs during a–h LOCO 4, i LOCO 5, j–n LOCO 6. Time is given in months/year, denoted as
mm/yy; November 2009 is e.g. indicated as 11/09. Notice differences in vertical scales and sampling periods. Labels indicate the site name, mean instrument depth and its height in meters-abovebottom (mab). Data in grey are identified as periods affected by blow-down and are, therefore,
replaced by NaNs. Further details in Table 2
As High-Pass filter we use a fourth-order Butterworth filter with zero-phase
response and cut-off frequency c −1 × í µí¼ c , where í µí¼ c = 0.83 cpd, corresponding to
a period of 29.07 h. The band width parameter, c = 1.25, was chosen to be narrow
enough to capture closely the lowest frequency of interest, í µí¼ c , while being wide
enough to avoid filter ‘ringing’ [1].
An example, illustrating steps (2)–(6), is shown in Fig. 3. Note that the residual signal (red curve) still contains (near) tidal variations, also during periods when