

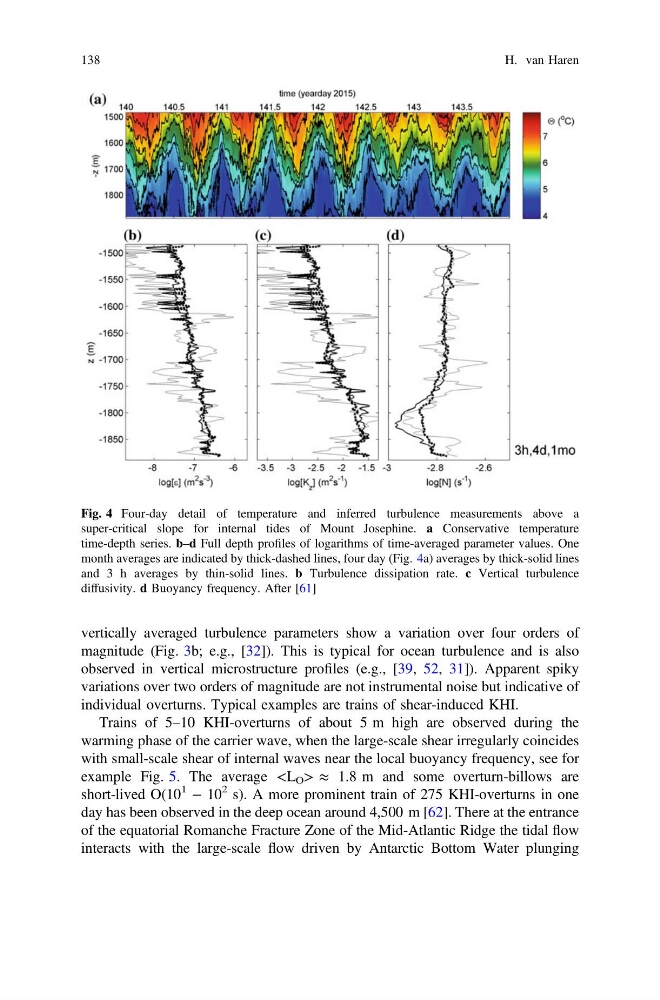
vertically averaged turbulence parameters show a variation over four orders of
magnitude (Fig. 3b; e.g., [32]). This is typical for ocean turbulence and is also
observed in vertical microstructure profiles (e.g., [39, 52, 31]). Apparent spiky
variations over two orders of magnitude are not instrumental noise but indicative of
individual overturns. Typical examples are trains of shear-induced KHI.
Trains of 5–10 KHI-overturns of about 5 m high are observed during the
warming phase of the carrier wave, when the large-scale shear irregularly coincides
with small-scale shear of internal waves near the local buoyancy frequency, see for
example Fig. 5. The average ≈ 1.8 m and some overturn-billows are
short-lived O(10
1
− 10
2 s). A more prominent train of 275 KHI-overturns in one
day has been observed in the deep ocean around 4,500 m [62]. There at the entrance
of the equatorial Romanche Fracture Zone of the Mid-Atlantic Ridge the tidal flow
interacts with the large-scale flow driven by Antarctic Bottom Water plunging
Fig. 4 Four-day detail of temperature and inferred turbulence measurements above a
super-critical slope for internal tides of Mount Josephine. a Conservative temperature
time-depth series. b–d Full depth profiles of logarithms of time-averaged parameter values. One
month averages are indicated by thick-dashed lines, four day (Fig. 4a) averages by thick-solid lines
and 3 h averages by thin-solid lines. b Turbulence dissipation rate. c Vertical turbulence
diffusivity. d Buoyancy frequency. After [61]
138
H. van Haren
magnitude (Fig. 3b; e.g., [32]). This is typical for ocean turbulence and is also
observed in vertical microstructure profiles (e.g., [39, 52, 31]). Apparent spiky
variations over two orders of magnitude are not instrumental noise but indicative of
individual overturns. Typical examples are trains of shear-induced KHI.
Trains of 5–10 KHI-overturns of about 5 m high are observed during the
warming phase of the carrier wave, when the large-scale shear irregularly coincides
with small-scale shear of internal waves near the local buoyancy frequency, see for
example Fig. 5. The average
short-lived O(10
1
− 10
2 s). A more prominent train of 275 KHI-overturns in one
day has been observed in the deep ocean around 4,500 m [62]. There at the entrance
of the equatorial Romanche Fracture Zone of the Mid-Atlantic Ridge the tidal flow
interacts with the large-scale flow driven by Antarctic Bottom Water plunging
Fig. 4 Four-day detail of temperature and inferred turbulence measurements above a
super-critical slope for internal tides of Mount Josephine. a Conservative temperature
time-depth series. b–d Full depth profiles of logarithms of time-averaged parameter values. One
month averages are indicated by thick-dashed lines, four day (Fig. 4a) averages by thick-solid lines
and 3 h averages by thin-solid lines. b Turbulence dissipation rate. c Vertical turbulence
diffusivity. d Buoyancy frequency. After [61]
138
H. van Haren