

coefficient. If this relationship is not tight a relatively large or dominant contribution
results of salinity to density variations, as around Mediterranean outflow of relatively warm and salty waters into a cooler and fresher Atlantic environment and in
polar near-surface regions where the cold waters lead to ambient low thermal
expansion coefficients, with added ice melt. This leads to intrusions of apparent
overturns that can last longer than the buoyancy period. If intrusions are thus
detectable they may qualitatively demonstrate turbulent motions, but quantitative
turbulent information is no longer obtainable [51]. In contrast, the above relationship is always tight for data from lakes, where temperature exclusively dominates
density variations, with the notion that the natural thermal expansion coefficient
changes sign at about 4 °C.
With a tight temperature-density relationship, turbulence dissipation rate ε =
c 1
2 d
2 N
3 and vertical eddy diffusivity K z = m 1 c 1
2 d
2 N are estimated from the T-sensor
data using the method of Thorpe [36]. Here, N is computed from the reordered
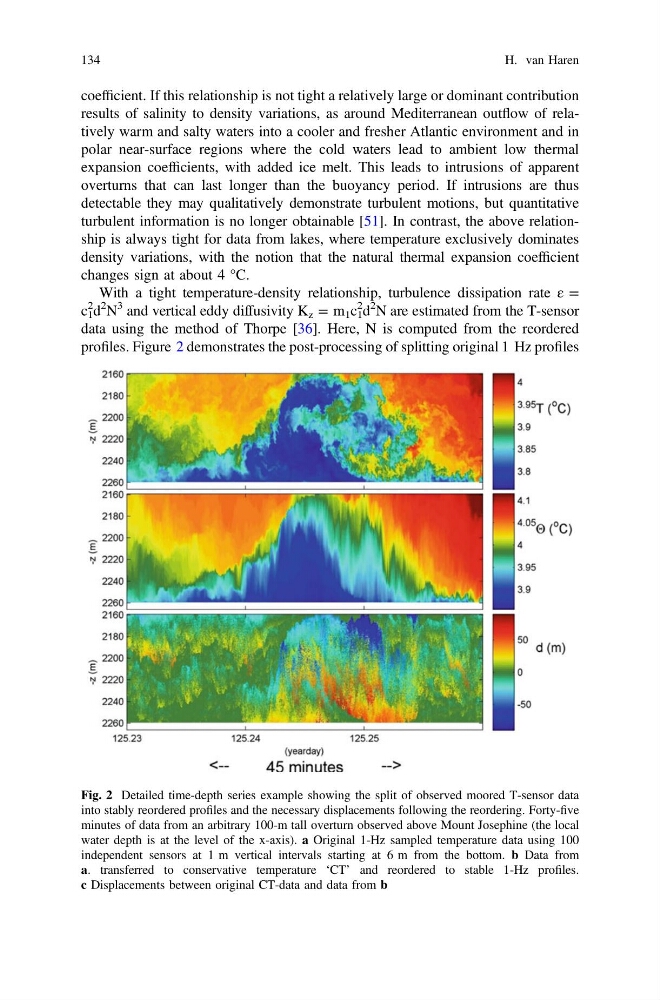
profiles. Figure 2 demonstrates the post-processing of splitting original 1 Hz profiles
Fig. 2 Detailed time-depth series example showing the split of observed moored T-sensor data
into stably reordered profiles and the necessary displacements following the reordering. Forty-five
minutes of data from an arbitrary 100-m tall overturn observed above Mount Josephine (the local
water depth is at the level of the x-axis). a Original 1-Hz sampled temperature data using 100
independent sensors at 1 m vertical intervals starting at 6 m from the bottom. b Data from
a. transferred to conservative temperature ‘CT’ and reordered to stable 1-Hz profiles.
c Displacements between original CT-data and data from b
134
H. van Haren
results of salinity to density variations, as around Mediterranean outflow of relatively warm and salty waters into a cooler and fresher Atlantic environment and in
polar near-surface regions where the cold waters lead to ambient low thermal
expansion coefficients, with added ice melt. This leads to intrusions of apparent
overturns that can last longer than the buoyancy period. If intrusions are thus
detectable they may qualitatively demonstrate turbulent motions, but quantitative
turbulent information is no longer obtainable [51]. In contrast, the above relationship is always tight for data from lakes, where temperature exclusively dominates
density variations, with the notion that the natural thermal expansion coefficient
changes sign at about 4 °C.
With a tight temperature-density relationship, turbulence dissipation rate ε =
c 1
2 d
2 N
3 and vertical eddy diffusivity K z = m 1 c 1
2 d
2 N are estimated from the T-sensor
data using the method of Thorpe [36]. Here, N is computed from the reordered
profiles. Figure 2 demonstrates the post-processing of splitting original 1 Hz profiles
Fig. 2 Detailed time-depth series example showing the split of observed moored T-sensor data
into stably reordered profiles and the necessary displacements following the reordering. Forty-five
minutes of data from an arbitrary 100-m tall overturn observed above Mount Josephine (the local
water depth is at the level of the x-axis). a Original 1-Hz sampled temperature data using 100
independent sensors at 1 m vertical intervals starting at 6 m from the bottom. b Data from
a. transferred to conservative temperature ‘CT’ and reordered to stable 1-Hz profiles.
c Displacements between original CT-data and data from b
134
H. van Haren