

separated T-sensors. This is achieved by using thin cables of 0.005 or 0.006 m
diameter that have breaking strengths >20,000 N. These cables are tensioned by up
to 5,000 N using a weight of >500 kg and net buoyancy of 300 kg where currents
reach 0.3–0.4 m s
−1 . Mooring design is verified using Richard Dewey’s software
(University of Victoria, BC, Canada). The mooring motion is always monitored by
mounting at least one current meter and pressure and tilt sensors.
The sensors are calibrated at NIOZ using a thermostatic bath with constant
temperature levels to within ±10
−4 °C of their preset values. The calibrated and
drift-corrected data are transferred to Conservative (∼potential) Temperature (Θ)
values using the gsw-software described in [50]. As the ocean density is also
determined by salinity besides temperature, several shipborne SeaBird-911
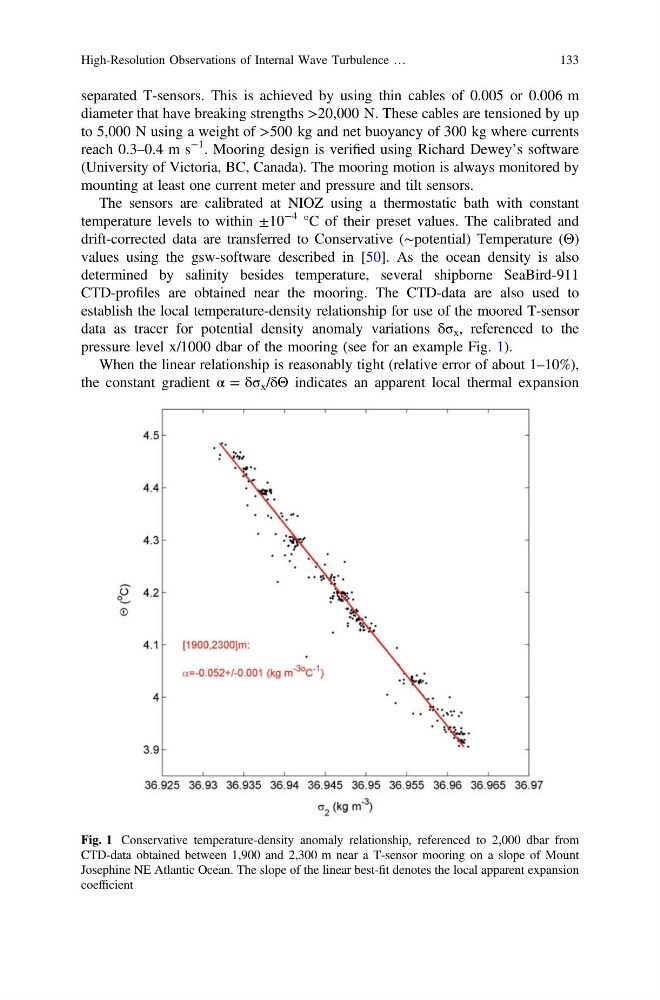
CTD-profiles are obtained near the mooring. The CTD-data are also used to
establish the local temperature-density relationship for use of the moored T-sensor
data as tracer for potential density anomaly variations δσ x , referenced to the
pressure level x/1000 dbar of the mooring (see for an example Fig. 1).
When the linear relationship is reasonably tight (relative error of about 1–10%),
the constant gradient α = δσ x /δΘ indicates an apparent local thermal expansion
Fig. 1 Conservative temperature-density anomaly relationship, referenced to 2,000 dbar from
CTD-data obtained between 1,900 and 2,300 m near a T-sensor mooring on a slope of Mount
Josephine NE Atlantic Ocean. The slope of the linear best-fit denotes the local apparent expansion
coefficient
High-Resolution Observations of Internal Wave Turbulence …
133
diameter that have breaking strengths >20,000 N. These cables are tensioned by up
to 5,000 N using a weight of >500 kg and net buoyancy of 300 kg where currents
reach 0.3–0.4 m s
−1 . Mooring design is verified using Richard Dewey’s software
(University of Victoria, BC, Canada). The mooring motion is always monitored by
mounting at least one current meter and pressure and tilt sensors.
The sensors are calibrated at NIOZ using a thermostatic bath with constant
temperature levels to within ±10
−4 °C of their preset values. The calibrated and
drift-corrected data are transferred to Conservative (∼potential) Temperature (Θ)
values using the gsw-software described in [50]. As the ocean density is also
determined by salinity besides temperature, several shipborne SeaBird-911
CTD-profiles are obtained near the mooring. The CTD-data are also used to
establish the local temperature-density relationship for use of the moored T-sensor
data as tracer for potential density anomaly variations δσ x , referenced to the
pressure level x/1000 dbar of the mooring (see for an example Fig. 1).
When the linear relationship is reasonably tight (relative error of about 1–10%),
the constant gradient α = δσ x /δΘ indicates an apparent local thermal expansion
Fig. 1 Conservative temperature-density anomaly relationship, referenced to 2,000 dbar from
CTD-data obtained between 1,900 and 2,300 m near a T-sensor mooring on a slope of Mount
Josephine NE Atlantic Ocean. The slope of the linear best-fit denotes the local apparent expansion
coefficient
High-Resolution Observations of Internal Wave Turbulence …
133