

THE NEAR-SURFACE LAYER OF THE OCEAN
resembling bursting event should almost simultaneously be observed at the
surface and at 2 cm.
Observations in the open ocean appear to be consistent with the idea of
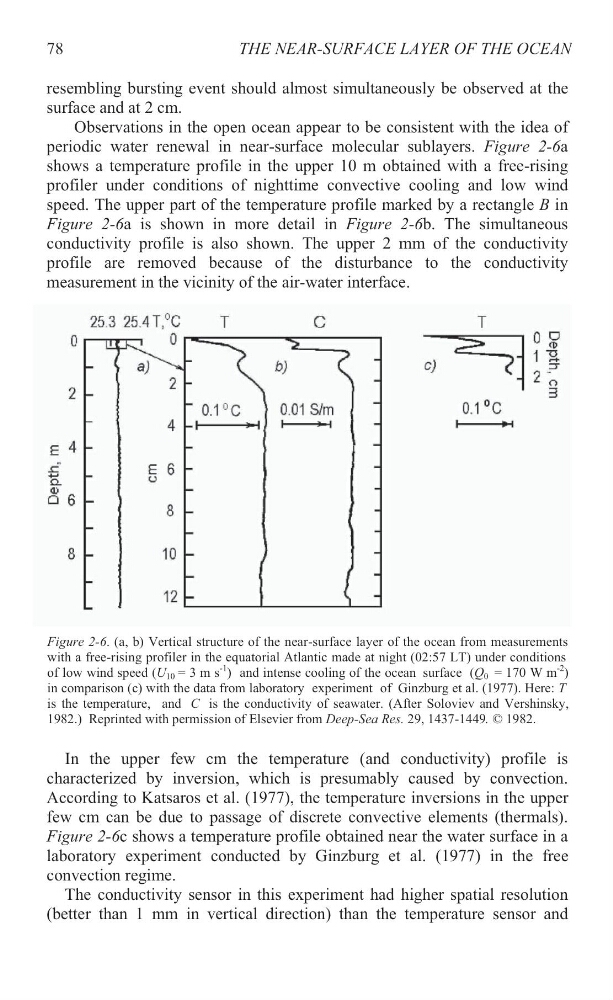
periodic water renewal in near-surface molecular sublayers. Figure 2-6a
shows a temperature profile in the upper 10 m obtained with a free-rising
profiler under conditions of nighttime convective cooling and low wind
speed. The upper part of the temperature profile marked by a rectangle B in
Figure 2-6a is shown in more detail in Figure 2-6b. The simultaneous
conductivity profile is also shown. The upper 2 mm of the conductivity
profile are removed because of the disturbance to the conductivity
measurement in the vicinity of the air-water interface.
In the upper few cm the temperature (and conductivity) profile is
characterized by inversion, which is presumably caused by convection.
According to Katsaros et al. (1977), the temperature inversions in the upper
few cm can be due to passage of discrete convective elements (thermals).
Figure 2-6c shows a temperature profile obtained near the water surface in a
laboratory experiment conducted by Ginzburg et al. (1977) in the free
convection regime.
The conductivity sensor in this experiment had higher spatial resolution
(better than 1 mm in vertical direction) than the temperature sensor and
78
Figure 2-6. (a, b) Vertical structure of the near-surface layer of the ocean from measurements
with a free-rising profiler in the equatorial Atlantic made at night (02:57 LT) under conditions
of low wind speed (U 10 = 3 m s
-1 ) and intense cooling of the ocean surface (Q 0 = 170 W m
-2 )
in comparison (c) with the data from laboratory experiment of Ginzburg et al. (1977). Here: T
is the temperature, and C is the conductivity of seawater. (After Soloviev and Vershinsky,
1982.) Reprinted with permission of Elsevier from Deep-Sea Res. 29, 1437-1449 © 1982.
.
resembling bursting event should almost simultaneously be observed at the
surface and at 2 cm.
Observations in the open ocean appear to be consistent with the idea of
periodic water renewal in near-surface molecular sublayers. Figure 2-6a
shows a temperature profile in the upper 10 m obtained with a free-rising
profiler under conditions of nighttime convective cooling and low wind
speed. The upper part of the temperature profile marked by a rectangle B in
Figure 2-6a is shown in more detail in Figure 2-6b. The simultaneous
conductivity profile is also shown. The upper 2 mm of the conductivity
profile are removed because of the disturbance to the conductivity
measurement in the vicinity of the air-water interface.
In the upper few cm the temperature (and conductivity) profile is
characterized by inversion, which is presumably caused by convection.
According to Katsaros et al. (1977), the temperature inversions in the upper
few cm can be due to passage of discrete convective elements (thermals).
Figure 2-6c shows a temperature profile obtained near the water surface in a
laboratory experiment conducted by Ginzburg et al. (1977) in the free
convection regime.
The conductivity sensor in this experiment had higher spatial resolution
(better than 1 mm in vertical direction) than the temperature sensor and
78
Figure 2-6. (a, b) Vertical structure of the near-surface layer of the ocean from measurements
with a free-rising profiler in the equatorial Atlantic made at night (02:57 LT) under conditions
of low wind speed (U 10 = 3 m s
-1 ) and intense cooling of the ocean surface (Q 0 = 170 W m
-2 )
in comparison (c) with the data from laboratory experiment of Ginzburg et al. (1977). Here: T
is the temperature, and C is the conductivity of seawater. (After Soloviev and Vershinsky,
1982.) Reprinted with permission of Elsevier from Deep-Sea Res. 29, 1437-1449 © 1982.
.