

THE NEAR-SURFACE LAYER OF THE OCEAN
468
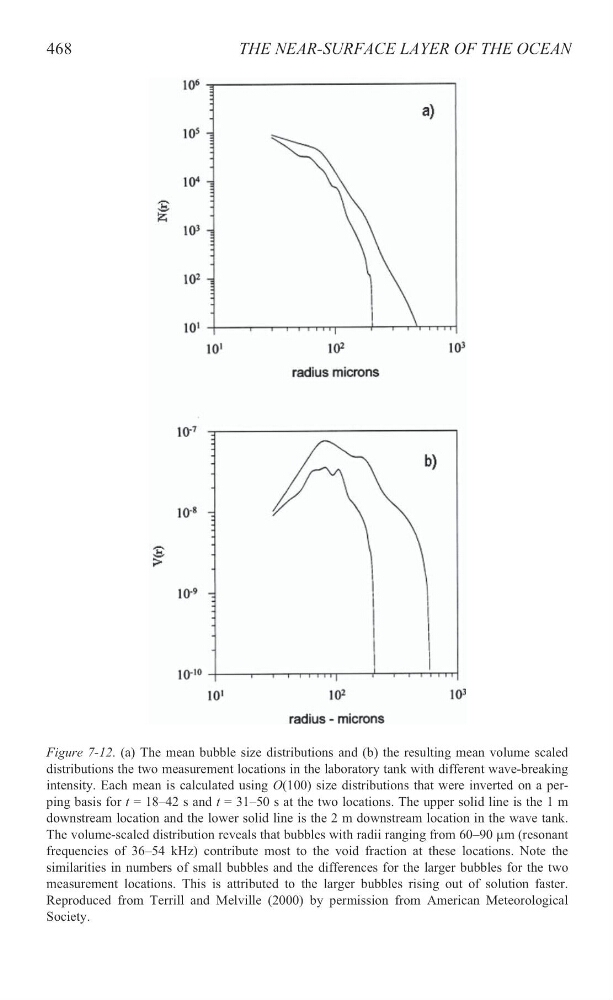
Figure 7-12. (a) The mean bubble size distributions and (b) the resulting mean volume scaled
distributions the two measurement locations in the laboratory tank with different wave-breaking
intensity. Each mean is calculated using O(100) size distributions that were inverted on a perping basis for t = 18–42 s and t = 31–50 s at the two locations. The upper solid line is the 1 m
downstream location and the lower solid line is the 2 m downstream location in the wave tank.
The volume-scaled distribution reveals that bubbles with radii ranging from 60–90 Pm (resonant
frequencies of 36–54 kHz) contribute most to the void fraction at these locations. Note the
similarities in numbers of small bubbles and the differences for the larger bubbles for the two
measurement locations. This is attributed to the larger bubbles rising out of solution faster.
Reproduced from Terrill and Melville (2000) by permission from American Meteorological
Society.
468
Figure 7-12. (a) The mean bubble size distributions and (b) the resulting mean volume scaled
distributions the two measurement locations in the laboratory tank with different wave-breaking
intensity. Each mean is calculated using O(100) size distributions that were inverted on a perping basis for t = 18–42 s and t = 31–50 s at the two locations. The upper solid line is the 1 m
downstream location and the lower solid line is the 2 m downstream location in the wave tank.
The volume-scaled distribution reveals that bubbles with radii ranging from 60–90 Pm (resonant
frequencies of 36–54 kHz) contribute most to the void fraction at these locations. Note the
similarities in numbers of small bubbles and the differences for the larger bubbles for the two
measurement locations. This is attributed to the larger bubbles rising out of solution faster.
Reproduced from Terrill and Melville (2000) by permission from American Meteorological
Society.