

THE NEAR-SURFACE LAYER OF THE OCEAN
a scattering cross section up to three orders of magnitude larger than that of a
solid particle of the same dimension. For acoustic frequencies much less
than the resonant frequencies of the bubbles, the speed of sound depends
solely on the volume of air present in the water. At higher frequencies,
bubble resonances cause the sound speed to become dependent on the bubble
size distribution.
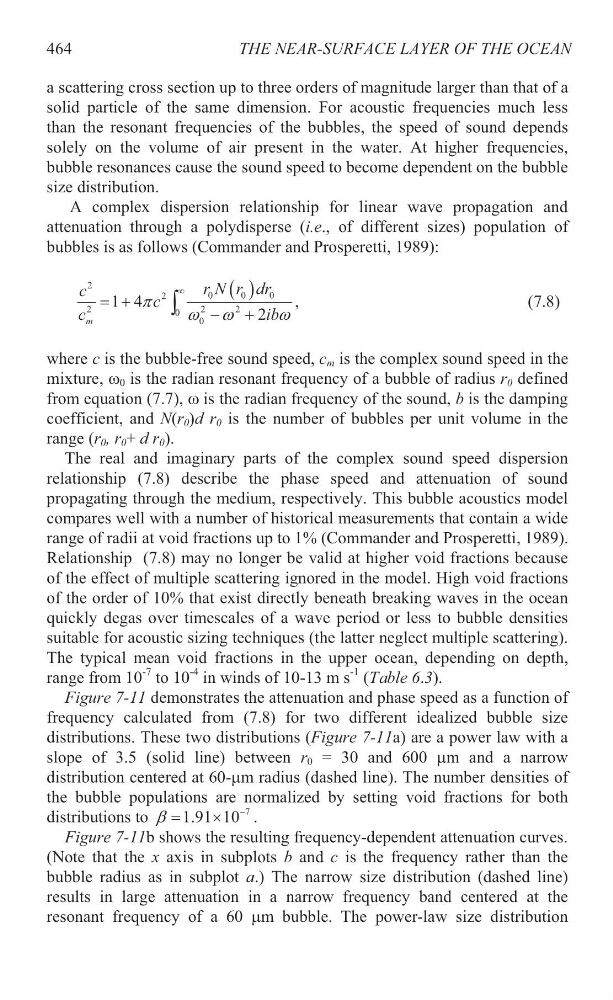
A complex dispersion relationship for linear wave propagation and
attenuation through a polydisperse (i.e., of different sizes) population of
bubbles is as follows (Commander and Prosperetti, 1989):
2
0
0
0
2
2
2
2
0
0
1 4
2
m
r N r dr
c
c
c
i b
S
Z Z
Z
f
³
,
(7.8)
where c is the bubble-free sound speed, c m is the complex sound speed in the
mixture, Z 0 is the radian resonant frequency of a bubble of radius r 0 defined
from equation (7.7), Z is the radian frequency of the sound, b is the damping
coefficient, and N(r 0 )d r 0 is the number of bubbles per unit volume in the
range (r 0 , r 0 + d r 0 ).
The real and imaginary parts of the complex sound speed dispersion
relationship (7.8) describe the phase speed and attenuation of sound
propagating through the medium, respectively. This bubble acoustics model
compares well with a number of historical measurements that contain a wide
range of radii at void fractions up to 1% (Commander and Prosperetti, 1989).
Relationship (7.8) may no longer be valid at higher void fractions because
of the effect of multiple scattering ignored in the model. High void fractions
of the order of 10% that exist directly beneath breaking waves in the ocean
quickly degas over timescales of a wave period or less to bubble densities
suitable for acoustic sizing techniques (the latter neglect multiple scattering).
The typical mean void fractions in the upper ocean, depending on depth,
range from 10
-7 to 10
-4 in winds of 10-13 m s
-1 (Table 6.3).
Figure 7-11 demonstrates the attenuation and phase speed as a function of
frequency calculated from (7.8) for two different idealized bubble size
distributions. These two distributions (Figure 7-11a) are a power law with a
slope of 3.5 (solid line) between r 0 = 30 and 600 Pm and a narrow
distribution centered at 60-Pm radius (dashed line). The number densities of
the bubble populations are normalized by setting void fractions for both
distributions to
7
1.91 10
E
u
.
Figure 7-11b shows the resulting frequency-dependent attenuation curves.
(Note that the x axis in subplots b and c is the frequency rather than the
bubble radius as in subplot a.) The narrow size distribution (dashed line)
results in large attenuation in a narrow frequency band centered at the
resonant frequency of a 60 Pm bubble. The power-law size distribution
464
a scattering cross section up to three orders of magnitude larger than that of a
solid particle of the same dimension. For acoustic frequencies much less
than the resonant frequencies of the bubbles, the speed of sound depends
solely on the volume of air present in the water. At higher frequencies,
bubble resonances cause the sound speed to become dependent on the bubble
size distribution.
A complex dispersion relationship for linear wave propagation and
attenuation through a polydisperse (i.e., of different sizes) population of
bubbles is as follows (Commander and Prosperetti, 1989):
2
0
0
0
2
2
2
2
0
0
1 4
2
m
r N r dr
c
c
c
i b
S
Z Z
Z
f
³
,
(7.8)
where c is the bubble-free sound speed, c m is the complex sound speed in the
mixture, Z 0 is the radian resonant frequency of a bubble of radius r 0 defined
from equation (7.7), Z is the radian frequency of the sound, b is the damping
coefficient, and N(r 0 )d r 0 is the number of bubbles per unit volume in the
range (r 0 , r 0 + d r 0 ).
The real and imaginary parts of the complex sound speed dispersion
relationship (7.8) describe the phase speed and attenuation of sound
propagating through the medium, respectively. This bubble acoustics model
compares well with a number of historical measurements that contain a wide
range of radii at void fractions up to 1% (Commander and Prosperetti, 1989).
Relationship (7.8) may no longer be valid at higher void fractions because
of the effect of multiple scattering ignored in the model. High void fractions
of the order of 10% that exist directly beneath breaking waves in the ocean
quickly degas over timescales of a wave period or less to bubble densities
suitable for acoustic sizing techniques (the latter neglect multiple scattering).
The typical mean void fractions in the upper ocean, depending on depth,
range from 10
-7 to 10
-4 in winds of 10-13 m s
-1 (Table 6.3).
Figure 7-11 demonstrates the attenuation and phase speed as a function of
frequency calculated from (7.8) for two different idealized bubble size
distributions. These two distributions (Figure 7-11a) are a power law with a
slope of 3.5 (solid line) between r 0 = 30 and 600 Pm and a narrow
distribution centered at 60-Pm radius (dashed line). The number densities of
the bubble populations are normalized by setting void fractions for both
distributions to
7
1.91 10
E
u
.
Figure 7-11b shows the resulting frequency-dependent attenuation curves.
(Note that the x axis in subplots b and c is the frequency rather than the
bubble radius as in subplot a.) The narrow size distribution (dashed line)
results in large attenuation in a narrow frequency band centered at the
resonant frequency of a 60 Pm bubble. The power-law size distribution
464