

THE NEAR-SURFACE LAYER OF THE OCEAN
Volume Scattering Strength in dB
462
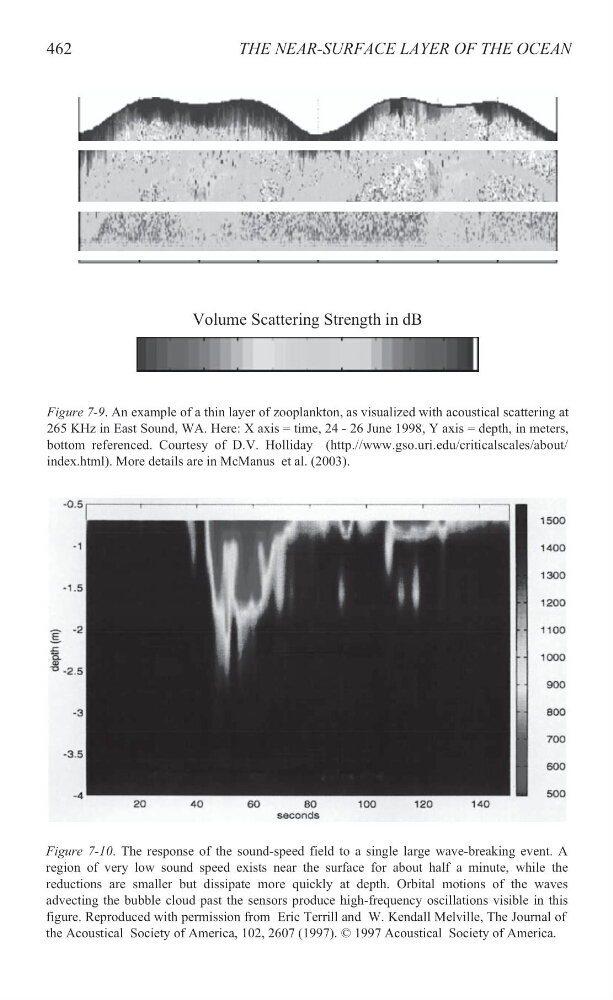
Figure 7-9. An example of a thin layer of zooplankton, as visualized with acoustical scattering at
265 KHz in East Sound, WA. Here: X axis = time, 24 - 26 June 1998, Y axis = depth, in meters,
bottom referenced. Courtesy of D.V. Holliday (http.//www.gso.uri.edu/criticalscales/about/
index.html). More details are in McManus et al. (2003).
Figure 7-10. The response of the sound-speed field to a single large wave-breaking event. A
region of very low sound speed exists near the surface for about half a minute, while the
reductions are smaller but dissipate more quickly at depth. Orbital motions of the waves
advecting the bubble cloud past the sensors produce high-frequency oscillations visible in this
the Acoustical Society of America, 102, 2607 (1997). © 1997 Acoustical Society of America.
figure. Reproduced with permission from Eric Terrill and W. Kendall Melville, The Journal of
Volume Scattering Strength in dB
462
Figure 7-9. An example of a thin layer of zooplankton, as visualized with acoustical scattering at
265 KHz in East Sound, WA. Here: X axis = time, 24 - 26 June 1998, Y axis = depth, in meters,
bottom referenced. Courtesy of D.V. Holliday (http.//www.gso.uri.edu/criticalscales/about/
index.html). More details are in McManus et al. (2003).
Figure 7-10. The response of the sound-speed field to a single large wave-breaking event. A
region of very low sound speed exists near the surface for about half a minute, while the
reductions are smaller but dissipate more quickly at depth. Orbital motions of the waves
advecting the bubble cloud past the sensors produce high-frequency oscillations visible in this
the Acoustical Society of America, 102, 2607 (1997). © 1997 Acoustical Society of America.
figure. Reproduced with permission from Eric Terrill and W. Kendall Melville, The Journal of