

THE NEAR-SURFACE LAYER OF THE OCEAN
Coefficients A k and B k on the right side of equation (6.23) describe the
size dependence. Mårtensson et al. (2003) utilized salinity and temperature
dependences shown in Figure 6-10 and Figure 6-11 (plus a size distribution
dependence from the same laboratory experiment) to derive the following
polynomial fit:
4
3
2
4
3
2
1
0
4
3
2
4
3
2
1
0
k
p
p
p
p
k
p
p
p
p
A c D c D c D c D c
B d D d D d D d D d
½
°
¾
° ¿
(6.24)
In Figure 6-12, the Mårtensson et al. (2003) parameterization at 9 m s
-1
wind speed and water temperatures of 25
o C and 5
o
C is compared with the
Monahan et al. (1986) and Smith et al. (1993) source parameterizations. For
consistency, the expressions for the source fluxes have been converted to
dF 0 /dlogD p (m
-2 s
-1 ), where D p is the dry diameter of aerosol particles.
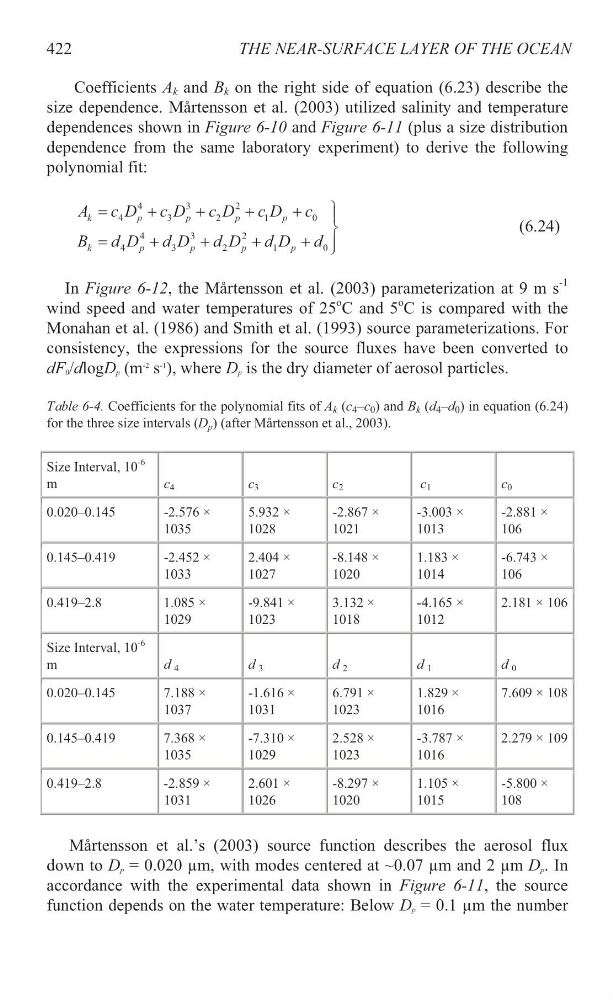
Table 6-4. Coefficients for the polynomial fits of A k (c 4 –c 0 ) and B k (d 4 –d 0 ) in equation (6.24)
for the three size intervals (D p ) (after Mårtensson et al., 2003).
Size Interval, 10
-6
m
c 4
c 3
c 2
c 1
c 0
0.020–0.145
-2.576 ×
1035
5.932 ×
1028
-2.867 ×
1021
-3.003 ×
1013
-2.881 ×
106
0.145–0.419
-2.452 ×
1033
2.404 ×
1027
-8.148 ×
1020
1.183 ×
1014
-6.743 ×
106
0.419–2.8
1.085 ×
1029
-9.841 ×
1023
3.132 ×
1018
-4.165 ×
1012
2.181 × 10⁶
Size Interval, 10
-6
m
d 4
d 3
d 2
d 1
d 0
0.020–0.145
7.188 ×
1037
-1.616 ×
1031
6.791 ×
1023
1.829 ×
1016
7.609 × 10⁸
0.145–0.419
7.368 ×
1035
-7.310 ×
1029
2.528 ×
1023
-3.787 ×
1016
2.279 × 10⁹
0.419–2.8
-2.859 ×
1031
2.601 ×
1026
-8.297 ×
1020
1.105 ×
1015
-5.800 ×
108
Mårtensson et al.’s (2003) source function describes the aerosol flux
down to D p = 0.020 µm, with modes centered at ~0.07 µm and 2 µm D p . In
accordance with the experimental data shown in Figure 6-11, the source
function depends on the water temperature: Below D p = 0.1 µm the number
422
Coefficients A k and B k on the right side of equation (6.23) describe the
size dependence. Mårtensson et al. (2003) utilized salinity and temperature
dependences shown in Figure 6-10 and Figure 6-11 (plus a size distribution
dependence from the same laboratory experiment) to derive the following
polynomial fit:
4
3
2
4
3
2
1
0
4
3
2
4
3
2
1
0
k
p
p
p
p
k
p
p
p
p
A c D c D c D c D c
B d D d D d D d D d
½
°
¾
° ¿
(6.24)
In Figure 6-12, the Mårtensson et al. (2003) parameterization at 9 m s
-1
wind speed and water temperatures of 25
o C and 5
o
C is compared with the
Monahan et al. (1986) and Smith et al. (1993) source parameterizations. For
consistency, the expressions for the source fluxes have been converted to
dF 0 /dlogD p (m
-2 s
-1 ), where D p is the dry diameter of aerosol particles.
Table 6-4. Coefficients for the polynomial fits of A k (c 4 –c 0 ) and B k (d 4 –d 0 ) in equation (6.24)
for the three size intervals (D p ) (after Mårtensson et al., 2003).
Size Interval, 10
-6
m
c 4
c 3
c 2
c 1
c 0
0.020–0.145
-2.576 ×
1035
5.932 ×
1028
-2.867 ×
1021
-3.003 ×
1013
-2.881 ×
106
0.145–0.419
-2.452 ×
1033
2.404 ×
1027
-8.148 ×
1020
1.183 ×
1014
-6.743 ×
106
0.419–2.8
1.085 ×
1029
-9.841 ×
1023
3.132 ×
1018
-4.165 ×
1012
2.181 × 10⁶
Size Interval, 10
-6
m
d 4
d 3
d 2
d 1
d 0
0.020–0.145
7.188 ×
1037
-1.616 ×
1031
6.791 ×
1023
1.829 ×
1016
7.609 × 10⁸
0.145–0.419
7.368 ×
1035
-7.310 ×
1029
2.528 ×
1023
-3.787 ×
1016
2.279 × 10⁹
0.419–2.8
-2.859 ×
1031
2.601 ×
1026
-8.297 ×
1020
1.105 ×
1015
-5.800 ×
108
Mårtensson et al.’s (2003) source function describes the aerosol flux
down to D p = 0.020 µm, with modes centered at ~0.07 µm and 2 µm D p . In
accordance with the experimental data shown in Figure 6-11, the source
function depends on the water temperature: Below D p = 0.1 µm the number
422