

Chapter 5. SPATIALLY-COHERENT STRUCTURES
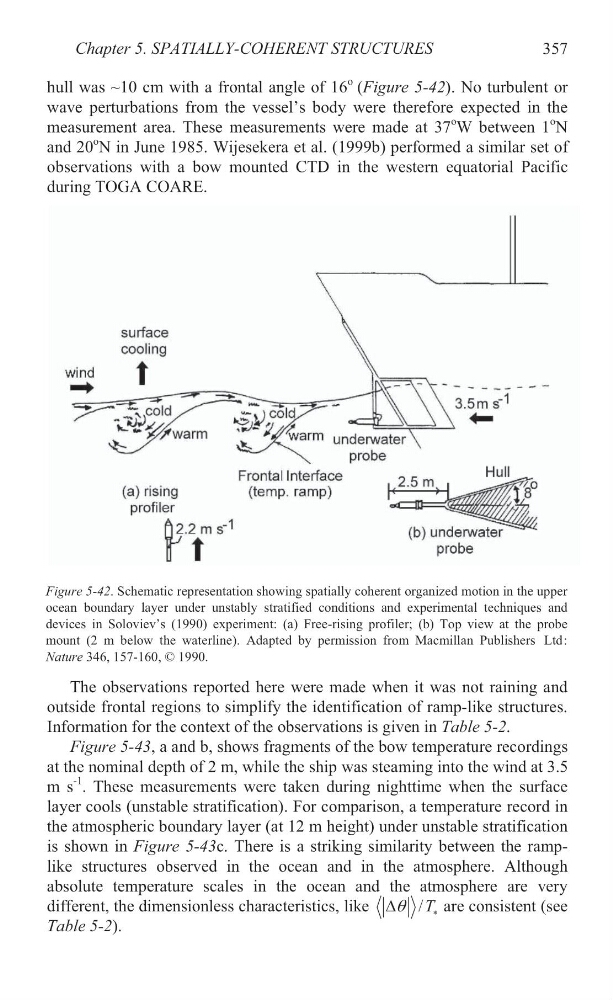
hull was ~10 cm with a frontal angle of 16
o (Figure 5-42). No turbulent or
wave perturbations from the vessel’s body were therefore expected in the
measurement area. These measurements were made at 37
o W between 1
o N
and 20
o N in June 1985. Wijesekera et al. (1999b) performed a similar set of
observations with a bow mounted CTD in the western equatorial Pacific
during TOGA COARE.
The observations reported here were made when it was not raining and
outside frontal regions to simplify the identification of ramp-like structures.
Information for the context of the observations is given in Table 5-2.
Figure 5-43, a and b, shows fragments of the bow temperature recordings
at the nominal depth of 2 m, while the ship was steaming into the wind at 3.5
m s
-1 . These measurements were taken during nighttime when the surface
layer cools (unstable stratification). For comparison, a temperature record in
the atmospheric boundary layer (at 12 m height) under unstable stratification
is shown in Figure 5-43c. There is a striking similarity between the ramplike structures observed in the ocean and in the atmosphere. Although
absolute temperature scales in the ocean and the atmosphere are very
different, the dimensionless characteristics, like
/T
T
'
are consistent (see
Table 5-2).
357
Figure 5-42. Schematic representation showing spatially coherent organized motion in the upper
ocean boundary layer under unstably stratified conditions and experimental techniques and
devices in Soloviev’s (1990) experiment: (a) Free-rising profiler; (b) Top view at the probe
mount (2 m below the waterline). Adapted by permission from Macmillan Publishers Ltd:
Nature 346, 157-160, © 1990.
hull was ~10 cm with a frontal angle of 16
o (Figure 5-42). No turbulent or
wave perturbations from the vessel’s body were therefore expected in the
measurement area. These measurements were made at 37
o W between 1
o N
and 20
o N in June 1985. Wijesekera et al. (1999b) performed a similar set of
observations with a bow mounted CTD in the western equatorial Pacific
during TOGA COARE.
The observations reported here were made when it was not raining and
outside frontal regions to simplify the identification of ramp-like structures.
Information for the context of the observations is given in Table 5-2.
Figure 5-43, a and b, shows fragments of the bow temperature recordings
at the nominal depth of 2 m, while the ship was steaming into the wind at 3.5
m s
-1 . These measurements were taken during nighttime when the surface
layer cools (unstable stratification). For comparison, a temperature record in
the atmospheric boundary layer (at 12 m height) under unstable stratification
is shown in Figure 5-43c. There is a striking similarity between the ramplike structures observed in the ocean and in the atmosphere. Although
absolute temperature scales in the ocean and the atmosphere are very
different, the dimensionless characteristics, like
/T
T
'
are consistent (see
Table 5-2).
357
Figure 5-42. Schematic representation showing spatially coherent organized motion in the upper
ocean boundary layer under unstably stratified conditions and experimental techniques and
devices in Soloviev’s (1990) experiment: (a) Free-rising profiler; (b) Top view at the probe
mount (2 m below the waterline). Adapted by permission from Macmillan Publishers Ltd:
Nature 346, 157-160, © 1990.