

Chapter 4: FINE STRUCTURE AND MICROSTRUCTURE
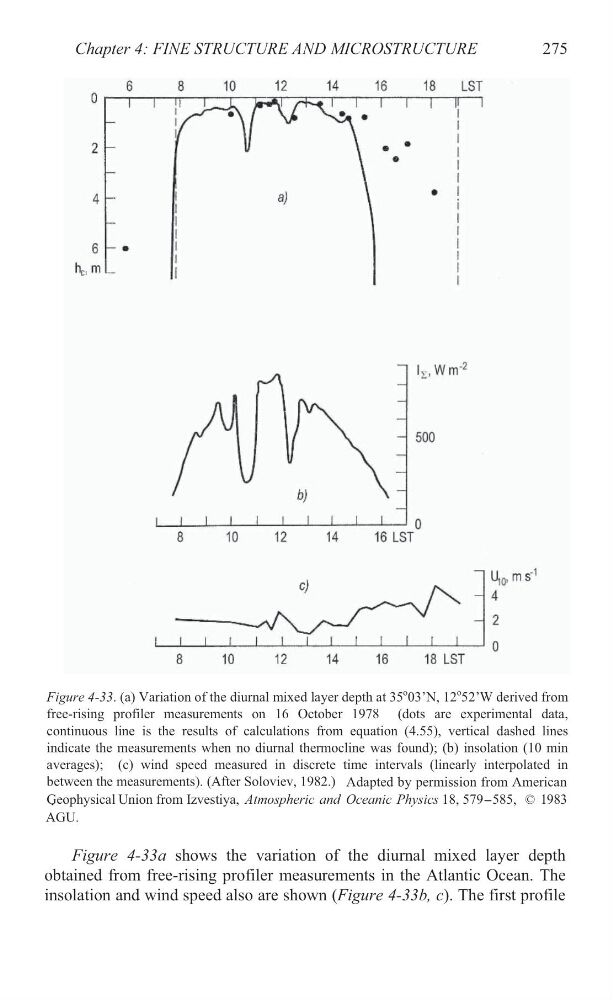
Figure 4-33. (a) Variation of the diurnal mixed layer depth at 35P
o
P03’N,
12P
o
P52’W
derived from
free-rising profiler measurements on 16 October 1978 (dots are experimental data,
continuous line is the results of calculations from equation X (4.55)X , vertical dashed lines
indicate the measurements when no diurnal thermocline was found); (b) insolation (10 min
averages); (c) wind speed measured in discrete time intervals (linearly interpolated in
between the measurements). (After Soloviev, 1982.)
.
Figure 4-33X a shows the variation of the diurnal mixed layer depth
obtained from free-rising profiler measurements in the Atlantic Ocean. The
insolation and wind speed also are shown (X Figure 4-33X b, c). The first profile
275
Adapted by permission from American
©
AGU.
Geophysical Union from Izvestiya, Atmospheric and Oceanic Physics 18, 579-585,
1983
Figure 4-33. (a) Variation of the diurnal mixed layer depth at 35P
o
P03’N,
12P
o
P52’W
derived from
free-rising profiler measurements on 16 October 1978 (dots are experimental data,
continuous line is the results of calculations from equation X (4.55)X , vertical dashed lines
indicate the measurements when no diurnal thermocline was found); (b) insolation (10 min
averages); (c) wind speed measured in discrete time intervals (linearly interpolated in
between the measurements). (After Soloviev, 1982.)
.
Figure 4-33X a shows the variation of the diurnal mixed layer depth
obtained from free-rising profiler measurements in the Atlantic Ocean. The
insolation and wind speed also are shown (X Figure 4-33X b, c). The first profile
275
Adapted by permission from American
©
AGU.
Geophysical Union from Izvestiya, Atmospheric and Oceanic Physics 18, 579-585,
1983