

THE NEAR-SURFACE LAYER OF THE OCEAN
4.1.2 Examples of near-surface structures associated with diurnal
cycle
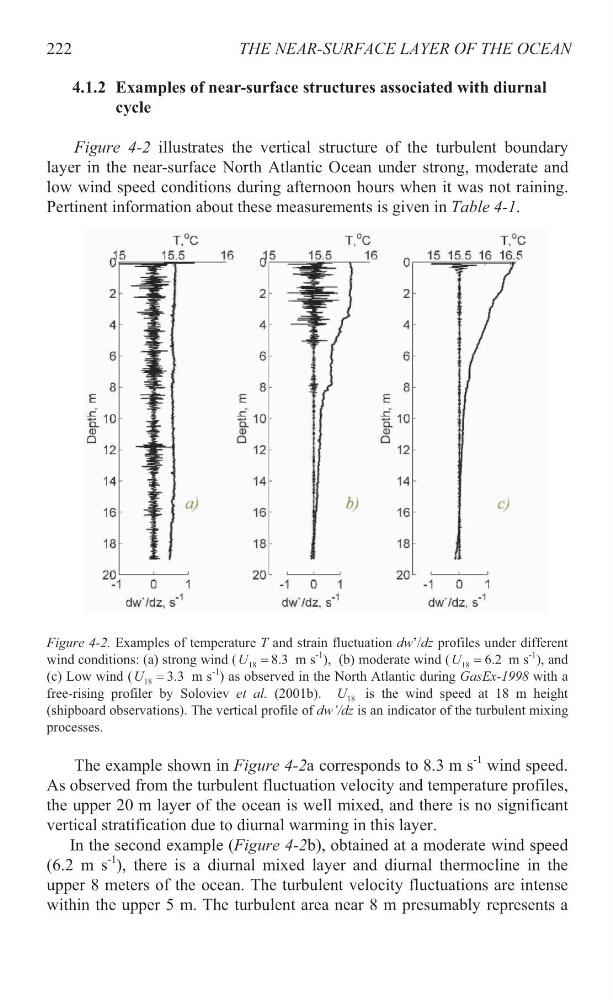
X Figure 4-2X illustrates the vertical structure of the turbulent boundary
layer in the near-surface North Atlantic Ocean under strong, moderate and
low wind speed conditions during afternoon hours when it was not raining.
Pertinent information about these measurements is given in X Table 4-1.
Figure 4-2. Examples of temperature T and strain fluctuation dw’/dz profiles under different
wind conditions: (a) strong wind ( 18 8.3
U
m sP
-1
P),
(b) moderate wind ( 18 6.2
U
m sP
-1
P),
and
(c) Low wind ( 18 3.3
U
m sP
-1
P)
as observed in the North Atlantic during GasEx-1998 with a
free-rising profiler by Soloviev et al. (2001b).
18
U is the wind speed at 18 m height
(shipboard observations). The vertical profile of dw’/dz is an indicator of the turbulent mixing
processes.
The example shown in X Figure 4-2X a corresponds to 8.3 m sP
-1
P
wind speed.
As observed from the turbulent fluctuation velocity and temperature profiles,
the upper 20 m layer of the ocean is well mixed, and there is no significant
vertical stratification due to diurnal warming in this layer.
In the second example (X Figure 4-2b), obtained at a moderate wind speed
(6.2 m sP
-1
P),
there is a diurnal mixed layer and diurnal thermocline in the
upper 8 meters of the ocean. The turbulent velocity fluctuations are intense
within the upper 5 m. The turbulent area near 8 m presumably represents a
222
4.1.2 Examples of near-surface structures associated with diurnal
cycle
X Figure 4-2X illustrates the vertical structure of the turbulent boundary
layer in the near-surface North Atlantic Ocean under strong, moderate and
low wind speed conditions during afternoon hours when it was not raining.
Pertinent information about these measurements is given in X Table 4-1.
Figure 4-2. Examples of temperature T and strain fluctuation dw’/dz profiles under different
wind conditions: (a) strong wind ( 18 8.3
U
m sP
-1
P),
(b) moderate wind ( 18 6.2
U
m sP
-1
P),
and
(c) Low wind ( 18 3.3
U
m sP
-1
P)
as observed in the North Atlantic during GasEx-1998 with a
free-rising profiler by Soloviev et al. (2001b).
18
U is the wind speed at 18 m height
(shipboard observations). The vertical profile of dw’/dz is an indicator of the turbulent mixing
processes.
The example shown in X Figure 4-2X a corresponds to 8.3 m sP
-1
P
wind speed.
As observed from the turbulent fluctuation velocity and temperature profiles,
the upper 20 m layer of the ocean is well mixed, and there is no significant
vertical stratification due to diurnal warming in this layer.
In the second example (X Figure 4-2b), obtained at a moderate wind speed
(6.2 m sP
-1
P),
there is a diurnal mixed layer and diurnal thermocline in the
upper 8 meters of the ocean. The turbulent velocity fluctuations are intense
within the upper 5 m. The turbulent area near 8 m presumably represents a
222