

THE NEAR-SURFACE LAYER OF THE OCEAN
Integration of the dissipation profile given by equation (3.43) from z = 0
to depth h 50 (where 50% of the wave energy dissipates) results in the
following equation for h 50 ,
50
50
0
0
1/ 2
3
3
0
0
3 /
/
0.5
n
w
q
w
h
h
dz
u
B S
z z z
dz
u
H
D
D
ª
º
¬
¼
³
³
(3.50)
The solution of this equation is
1/
50
0
0
2
1
/3
n
h
z
z
|
.
(3.51)
182
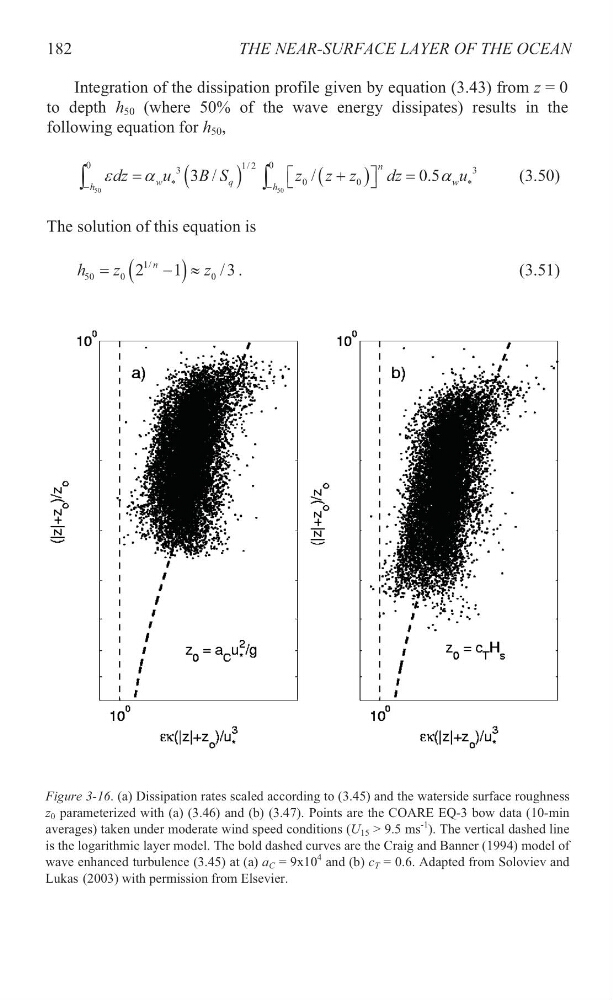
Figure 3-16. (a) Dissipation rates scaled according to (3.45) and the waterside surface roughness
z 0 parameterized with (a) (3.46) and (b) (3.47). Points are the COARE EQ-3 bow data (10-min
averages) taken under moderate wind speed conditions (U 15 > 9.5 ms
-1 ). The vertical dashed line
is the logarithmic layer model. The bold dashed curves are the Craig and Banner (1994) model of
wave enhanced turbulence (3.45) at (a) a C = 9x10
4 and (b) c T = 0.6. Adapted from Soloviev and
Lukas (2003) with permission from Elsevier.
Integration of the dissipation profile given by equation (3.43) from z = 0
to depth h 50 (where 50% of the wave energy dissipates) results in the
following equation for h 50 ,
50
50
0
0
1/ 2
3
3
0
0
3 /
/
0.5
n
w
q
w
h
h
dz
u
B S
z z z
dz
u
H
D
D
ª
º
¬
¼
³
³
(3.50)
The solution of this equation is
1/
50
0
0
2
1
/3
n
h
z
z
|
.
(3.51)
182
Figure 3-16. (a) Dissipation rates scaled according to (3.45) and the waterside surface roughness
z 0 parameterized with (a) (3.46) and (b) (3.47). Points are the COARE EQ-3 bow data (10-min
averages) taken under moderate wind speed conditions (U 15 > 9.5 ms
-1 ). The vertical dashed line
is the logarithmic layer model. The bold dashed curves are the Craig and Banner (1994) model of
wave enhanced turbulence (3.45) at (a) a C = 9x10
4 and (b) c T = 0.6. Adapted from Soloviev and
Lukas (2003) with permission from Elsevier.