

THE NEAR-SURFACE LAYER OF THE OCEAN
In Figure 2-15, vertical profiles of T
' , T
' , and T
' within the upper
4 cm of the ocean have been calculated for three wind-speed and two heatflux regimes from equations (2.76), (2.84), and (2.72), respectively. Shown
in Figure 2-15 are the instantaneous profiles developed after a surface
renewal event at the end of the renewal time period (i.e., at t t ). The
renewal time is determined from formula (2.90) with the surface Richardson
number defined by equation (2.97).
As expected the low wind speed regime shows the greatest temperature
deviations extending to depths of several centimeters (Figure 2-15 a, b). The
model calculations are consistent with the instantaneous temperature profiles
in the open ocean that have been observed with the free-rising profiler (see
Figure 2-3 and Section 2.2.1)
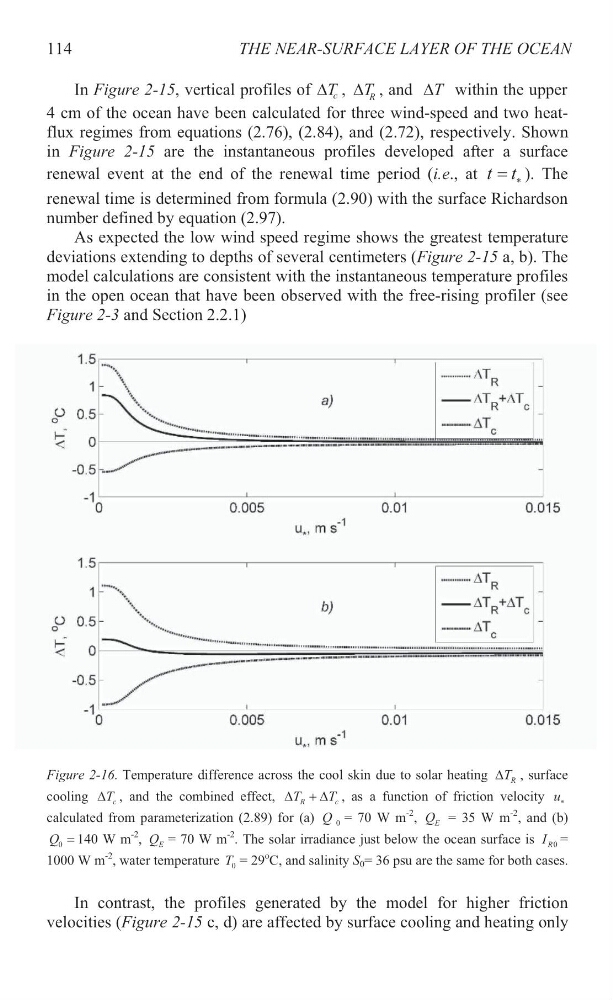
Figure 2-16. Temperature difference across the cool skin due to solar heating
R
T
' , surface
cooling
c
T
' , and the combined effect,
R
c
T
T
' ' , as a function of friction velocity u
0 = 70 W m
-2 , E
Q = 35 W m
-2
, and (b)
0
Q 140 W m
-2 , E
Q = 70 W m
-2
0
R =
1000 W m
-2 , water temperature 0
T = 29
o C, and salinity S 0 = 36 psu are the same for both cases.
In contrast, the profiles generated by the model for higher friction
velocities (Figure 2-15 c, d) are affected by surface cooling and heating only
114
c
R
. The solar irradiance just below the ocean surface is I
calculated from parameterization (2.89) for (a) Q
In Figure 2-15, vertical profiles of T
' , T
' , and T
' within the upper
4 cm of the ocean have been calculated for three wind-speed and two heatflux regimes from equations (2.76), (2.84), and (2.72), respectively. Shown
in Figure 2-15 are the instantaneous profiles developed after a surface
renewal event at the end of the renewal time period (i.e., at t t ). The
renewal time is determined from formula (2.90) with the surface Richardson
number defined by equation (2.97).
As expected the low wind speed regime shows the greatest temperature
deviations extending to depths of several centimeters (Figure 2-15 a, b). The
model calculations are consistent with the instantaneous temperature profiles
in the open ocean that have been observed with the free-rising profiler (see
Figure 2-3 and Section 2.2.1)
Figure 2-16. Temperature difference across the cool skin due to solar heating
R
T
' , surface
cooling
c
T
' , and the combined effect,
R
c
T
T
' ' , as a function of friction velocity u
0 = 70 W m
-2 , E
Q = 35 W m
-2
, and (b)
0
Q 140 W m
-2 , E
Q = 70 W m
-2
0
R =
1000 W m
-2 , water temperature 0
T = 29
o C, and salinity S 0 = 36 psu are the same for both cases.
In contrast, the profiles generated by the model for higher friction
velocities (Figure 2-15 c, d) are affected by surface cooling and heating only
114
c
R
. The solar irradiance just below the ocean surface is I
calculated from parameterization (2.89) for (a) Q