

Toward Marine Environmental Predictions in the Mediterranean Sea Coastal Areas
375
DlATOMS I...,cm/)
00
sa
,o<
-2
.- ,
,
,
-4
-4
,
-6
~
1
1
-8
-8
~
1
___________ 4 0 -4
- 10
-10
40
- 12
-12
- 14
-14
-14
-16
-16
-1.
1
-18
-18
-'8
- 20
181 001 061 12Z 181 001 061
- 20 0
181 001 061 12Z 181 001 06Z
sa
100
, ~
90ei l ooCi
110CT
90Ci 100CT
IIOCT
1995
1995
FUGI'LI..,.c.In'l
'00
-2
-2
80
-4
- 4
60~J1?-6
- 6
~
~60
- 8
40
40--------4
...
- 8
- 10
-10
2 0 - -
2
-12
-12
-14
_1 4 I
- 14
,
-16
-16
-1.
-1 8
-,e
-18
- 20
-20
o
sa
,O<
18Z OOZ 06Z 12Z 18Z OOZ 06Z
18Z OOZ 06Z 12Z 18Z OOZ 06Z
90Ci looCi
110CT
90CT 100CT
110CT
1995
1995
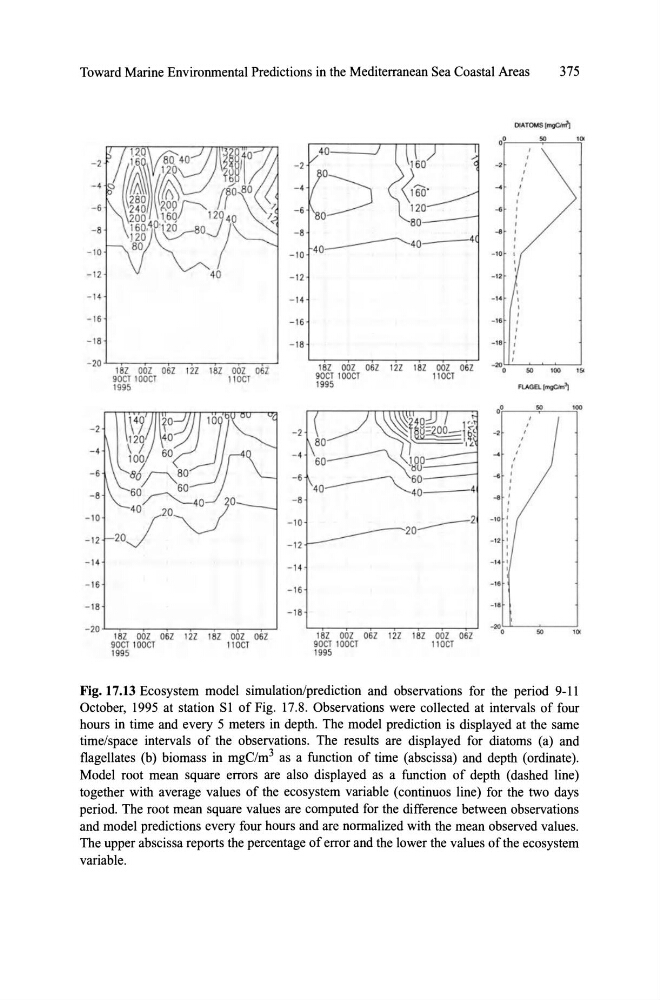
Fig. 17.13 Ecosystem model simulation/prediction and observations for the period 9- 11
October, 1995 at station SI of Fig. 17.8. Observations were collected at intervals of four
hours in time and every 5 meters in depth. The model prediction is displayed at the same
time/space intervals of the observations. The results are displayed for diatoms (a) and
flagellates (b) biomass in mgC/m 3 as a function of time (abscissa) and depth (ordinate).
Model root mean square errors are also displayed as a function of depth (dashed line)
together with average values of the ecosystem variable (continuos line) for the two days
period. The root mean square values are computed for the difference between observations
and model predictions every four hours and are norrnalized with the mean observed values.
The upper abscissa reports the percentage of error and the lower the values of the ecosystem
variable.
375
DlATOMS I...,cm/)
00
sa
,o<
-2
.- ,
,
,
-4
-4
,
-6
~
1
1
-8
-8
~
1
___________ 4 0 -4
- 10
-10
40
- 12
-12
- 14
-14
-14
-16
-16
-1.
1
-18
-18
-'8
- 20
181 001 061 12Z 181 001 061
- 20 0
181 001 061 12Z 181 001 06Z
sa
100
, ~
90ei l ooCi
110CT
90Ci 100CT
IIOCT
1995
1995
FUGI'LI..,.c.In'l
'00
-2
-2
80
-4
- 4
60~J1?-6
- 6
~
~60
- 8
40
40--------4
...
- 8
- 10
-10
2 0 - -
2
-12
-12
-14
_1 4 I
- 14
,
-16
-16
-1.
-1 8
-,e
-18
- 20
-20
o
sa
,O<
18Z OOZ 06Z 12Z 18Z OOZ 06Z
18Z OOZ 06Z 12Z 18Z OOZ 06Z
90Ci looCi
110CT
90CT 100CT
110CT
1995
1995
Fig. 17.13 Ecosystem model simulation/prediction and observations for the period 9- 11
October, 1995 at station SI of Fig. 17.8. Observations were collected at intervals of four
hours in time and every 5 meters in depth. The model prediction is displayed at the same
time/space intervals of the observations. The results are displayed for diatoms (a) and
flagellates (b) biomass in mgC/m 3 as a function of time (abscissa) and depth (ordinate).
Model root mean square errors are also displayed as a function of depth (dashed line)
together with average values of the ecosystem variable (continuos line) for the two days
period. The root mean square values are computed for the difference between observations
and model predictions every four hours and are norrnalized with the mean observed values.
The upper abscissa reports the percentage of error and the lower the values of the ecosystem
variable.