

On North Atlantic lntedecadal Variability: A Stochastic View
169
o) Regr. SLP /Overl hPo/Sv Da
ao_
.ION
,ON
\Oi<
e) Regr . V25/0vert. cm/s/Sv 00
,ON
ION
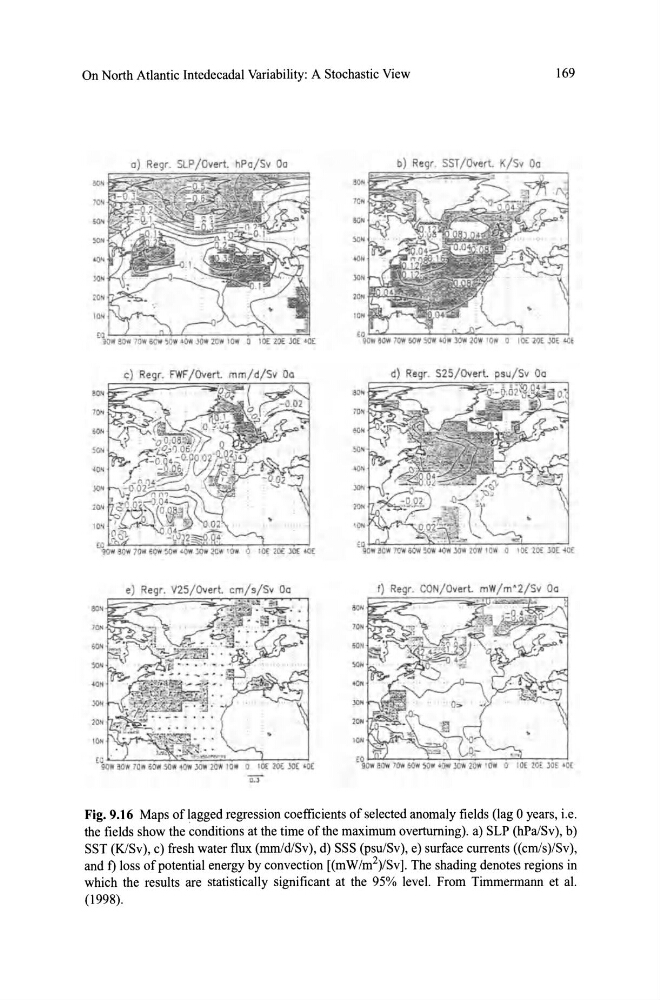
Fig. 9.16 Maps of lagged regression coefficients of selected anomaly fields (lag O years, i.e.
the fields show the conditions at the time ofthe maximum overtuming). a) SLP (hPa/Sv), b)
SST (KlSv), c) fresh water flux (mmJd/Sv), d) SSS (psu/Sv), e) surface currents ((cm/s)/Sv),
and f) loss of potential energy by convection [(mW/m 2 )/Sv] . The shading denotes regions in
which the results are statistically significant at the 95% level. From Timmermann et al.
(1998).
169
o) Regr. SLP /Overl hPo/Sv Da
ao_
.ION
,ON
\Oi<
e) Regr . V25/0vert. cm/s/Sv 00
,ON
ION
Fig. 9.16 Maps of lagged regression coefficients of selected anomaly fields (lag O years, i.e.
the fields show the conditions at the time ofthe maximum overtuming). a) SLP (hPa/Sv), b)
SST (KlSv), c) fresh water flux (mmJd/Sv), d) SSS (psu/Sv), e) surface currents ((cm/s)/Sv),
and f) loss of potential energy by convection [(mW/m 2 )/Sv] . The shading denotes regions in
which the results are statistically significant at the 95% level. From Timmermann et al.
(1998).