

162 Mojib Latif, Axei Timrnennann, Anselm Gr6tzner, Christian Eckert, Reinhard Voss
SSTA (40-80W, 25-45N)
a)
1.0 r---:1r------;r--~-.,..----.,_--~--___r--__,.__,
0.5
00
-0.5
-1.0 L-___'----!..~_~--'-~...!....~ _ _'_~__.l_~_'__ _ _ _ _ ' _ _ _ __'__'____I.___'
1500
aso
500
7S0
1000
12S0
North Atlanlic Osciilalion
b)
10 r---:1------,-----,----~----r_---__,.__,
S
o
-S
- 10 L-___'--'-~_~--'-~_~_-L~ _ _ _ _ _'__ _ _ _ _ '__ _ _ _ ___'~
250
500
750
1000
12S0
maximum meridional overtuming
c)
4 r---:1r------,- - - - - _ r - - - - - - . , -- - - -- r _ - - - - , - - ,
2
O
-2
-4 L--2~5-0------ 5~ 00~-~-- 7S~ 0-~--- lOOO-'-----~=, =2L50 -~--,5 ~0~0
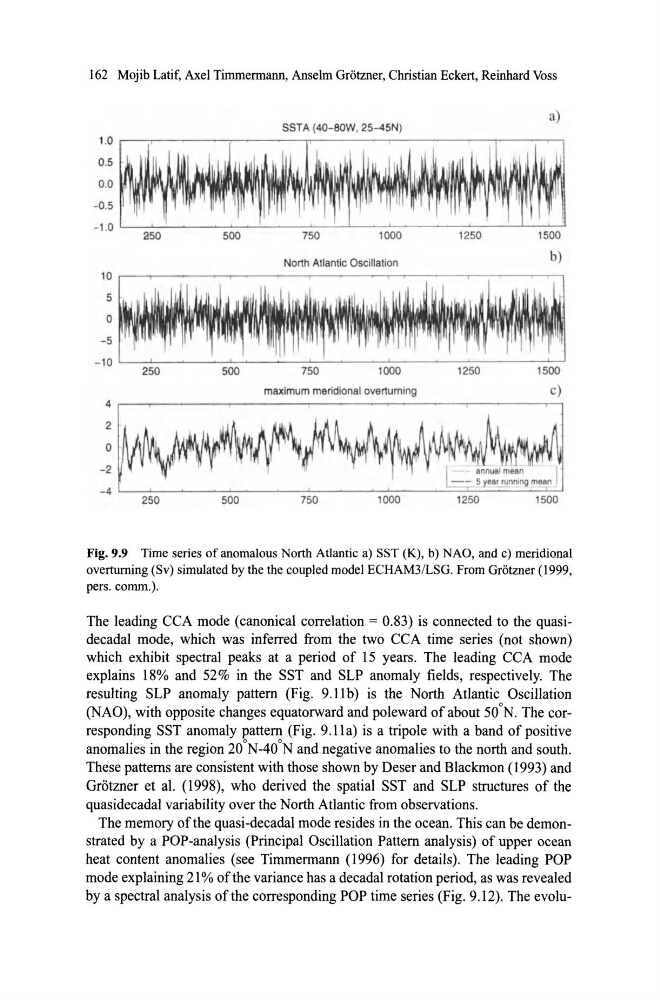
Fig.9.9 Time series of anomalous North Atlantic a) SST (K), b) NAO, and c) meridional
overturning (Sv) simulated by the the coupled model ECHAM3ILSG. From Gr6tzner (1999,
pers. comrn.).
The leading CCA mode (canonic al correlation = 0.83) is connected to the quasidecadal mode, which was inferred from the two CCA time series (not shown)
which exhibit spectral peaks at a period of 15 years. The leading CCA mode
explains 18% and 52 % in the SST and SLP anomaly fields, respectively. The
resulting SLP anomaly pattern (Fig. 9.11b) is the North Atlantic Oscillation
(NAO), with opposite changes equatorward and poleward of about 50 o N. The corresponding SST anomaly pattern (Fig. 9.1 la) is a tripole with a band of positive
anomalies in the region 20 o N-40oN and negative anomalies to the north and south.
These patterns are consistent with those shown by Deser and Blackmon (1993) and
GrBtzner et al. (1998), who derived the spatial SST and SLP structures of the
quasidecadal variability over the North Atlantic from observations.
The memory of the quasi-decadal mode resides in the ocean. This can be demonstrated by a POP-analysis (Principal Oscillation Pattern analysis) of upper ocean
heat content anomalies (see Timmermann (1996) for details). The leading POP
mode explaining 21 % of the variance has a decadal rotation period, as was revealed
by a spectral analysis ofthe corresponding POP time series (Fig. 9.12). The evolu-
SSTA (40-80W, 25-45N)
a)
1.0 r---:1r------;r--~-.,..----.,_--~--___r--__,.__,
0.5
00
-0.5
-1.0 L-___'----!..~_~--'-~...!....~ _ _'_~__.l_~_'__ _ _ _ _ ' _ _ _ __'__'____I.___'
1500
aso
500
7S0
1000
12S0
North Atlanlic Osciilalion
b)
10 r---:1------,-----,----~----r_---__,.__,
S
o
-S
- 10 L-___'--'-~_~--'-~_~_-L~ _ _ _ _ _'__ _ _ _ _ '__ _ _ _ ___'~
250
500
750
1000
12S0
maximum meridional overtuming
c)
4 r---:1r------,- - - - - _ r - - - - - - . , -- - - -- r _ - - - - , - - ,
2
O
-2
-4 L--2~5-0------ 5~ 00~-~-- 7S~ 0-~--- lOOO-'-----~=, =2L50 -~--,5 ~0~0
Fig.9.9 Time series of anomalous North Atlantic a) SST (K), b) NAO, and c) meridional
overturning (Sv) simulated by the the coupled model ECHAM3ILSG. From Gr6tzner (1999,
pers. comrn.).
The leading CCA mode (canonic al correlation = 0.83) is connected to the quasidecadal mode, which was inferred from the two CCA time series (not shown)
which exhibit spectral peaks at a period of 15 years. The leading CCA mode
explains 18% and 52 % in the SST and SLP anomaly fields, respectively. The
resulting SLP anomaly pattern (Fig. 9.11b) is the North Atlantic Oscillation
(NAO), with opposite changes equatorward and poleward of about 50 o N. The corresponding SST anomaly pattern (Fig. 9.1 la) is a tripole with a band of positive
anomalies in the region 20 o N-40oN and negative anomalies to the north and south.
These patterns are consistent with those shown by Deser and Blackmon (1993) and
GrBtzner et al. (1998), who derived the spatial SST and SLP structures of the
quasidecadal variability over the North Atlantic from observations.
The memory of the quasi-decadal mode resides in the ocean. This can be demonstrated by a POP-analysis (Principal Oscillation Pattern analysis) of upper ocean
heat content anomalies (see Timmermann (1996) for details). The leading POP
mode explaining 21 % of the variance has a decadal rotation period, as was revealed
by a spectral analysis ofthe corresponding POP time series (Fig. 9.12). The evolu-