

156 Mojib Latif, AxeI Timmennann, Anselm Gr6tzner, Christian Eckert, Reinhard Voss
y'(t) = - Ay(t) + ~(t),
(1)
with A representing a damping parameter and ~ the atmospheric forcing that is
assumed to be white noise. The oceanic response G(O)) is given within this concept
by
(2)
Here, O) denotes the frequency and cr the standard deviation of the white noise
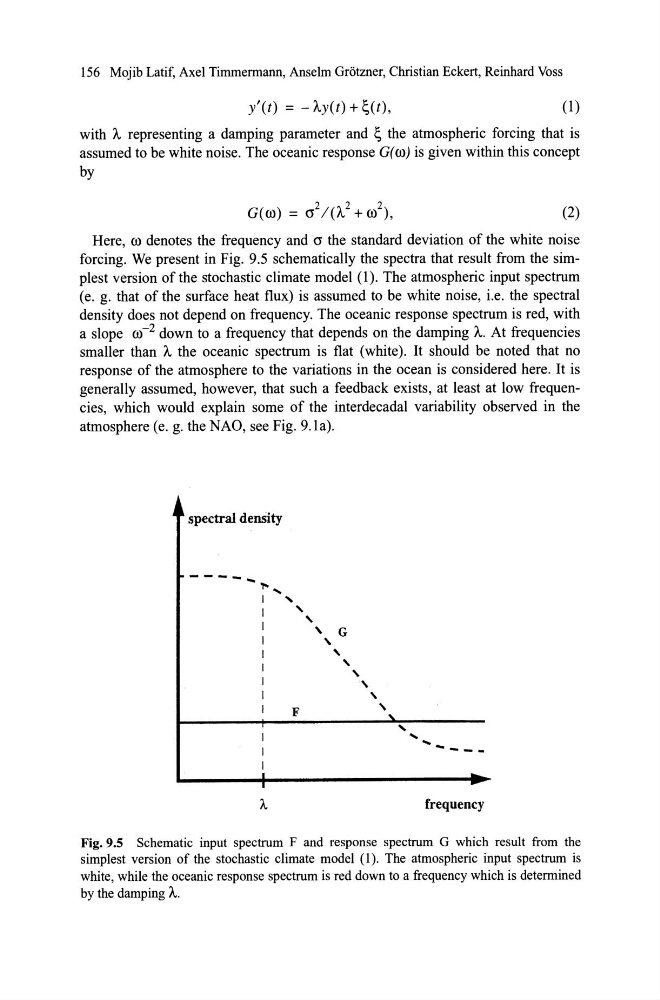
forcing. We present in Fig. 9.5 schematically the spectra that result from the simplest vers ion ofthe stochastic climate model (1). The atmospheric input spectrum
(e. g. that of the surface heat flux) is assumed to be white noi se, i.e. the spectral
density does not depend on frequency. The oceanic response spectrum is red, with
a slope 0)-2 down to a frequency that depends on the damping A. At frequencies
smaller than ÎI. the oceanic spectrum is flat (white). It should be noted that no
response of the atmosphere to the variations in the ocean is considered here. It is
generally assumed, however, that such a feedback exists, at least at low frequencies, which would explain some of the interdecadal variability observed in the
atmosphere (e. g. the NAO, see Fig. 9.la).
spectral density
---- ...... "', I ...
I
...
I
...
I
" G
I
...
I
... ' "
I
'"
I
,
' F
'"
... , ... ---- ..
frequency
Fig.9.5 Schematic input spectrum F and response spectrum G which result from the
simplest version of the stochastic climate model (1). The atmospheric input spectrum is
white, while the oceanic response spectrum is red down to a frequency which is detennined
by the damping ÎI..
y'(t) = - Ay(t) + ~(t),
(1)
with A representing a damping parameter and ~ the atmospheric forcing that is
assumed to be white noise. The oceanic response G(O)) is given within this concept
by
(2)
Here, O) denotes the frequency and cr the standard deviation of the white noise
forcing. We present in Fig. 9.5 schematically the spectra that result from the simplest vers ion ofthe stochastic climate model (1). The atmospheric input spectrum
(e. g. that of the surface heat flux) is assumed to be white noi se, i.e. the spectral
density does not depend on frequency. The oceanic response spectrum is red, with
a slope 0)-2 down to a frequency that depends on the damping A. At frequencies
smaller than ÎI. the oceanic spectrum is flat (white). It should be noted that no
response of the atmosphere to the variations in the ocean is considered here. It is
generally assumed, however, that such a feedback exists, at least at low frequencies, which would explain some of the interdecadal variability observed in the
atmosphere (e. g. the NAO, see Fig. 9.la).
spectral density
---- ...... "', I ...
I
...
I
...
I
" G
I
...
I
... ' "
I
'"
I
,
' F
'"
... , ... ---- ..
frequency
Fig.9.5 Schematic input spectrum F and response spectrum G which result from the
simplest version of the stochastic climate model (1). The atmospheric input spectrum is
white, while the oceanic response spectrum is red down to a frequency which is detennined
by the damping ÎI..