

Sequential Data Assimilation for Nonlinear Dynamics: The Ensemble Kalman Filter
115
o
Vertical la er distribution alon 49W
100
200
300
400
.s:;.soo
... itJoo
°700
800
900
1000
1100
1200
10
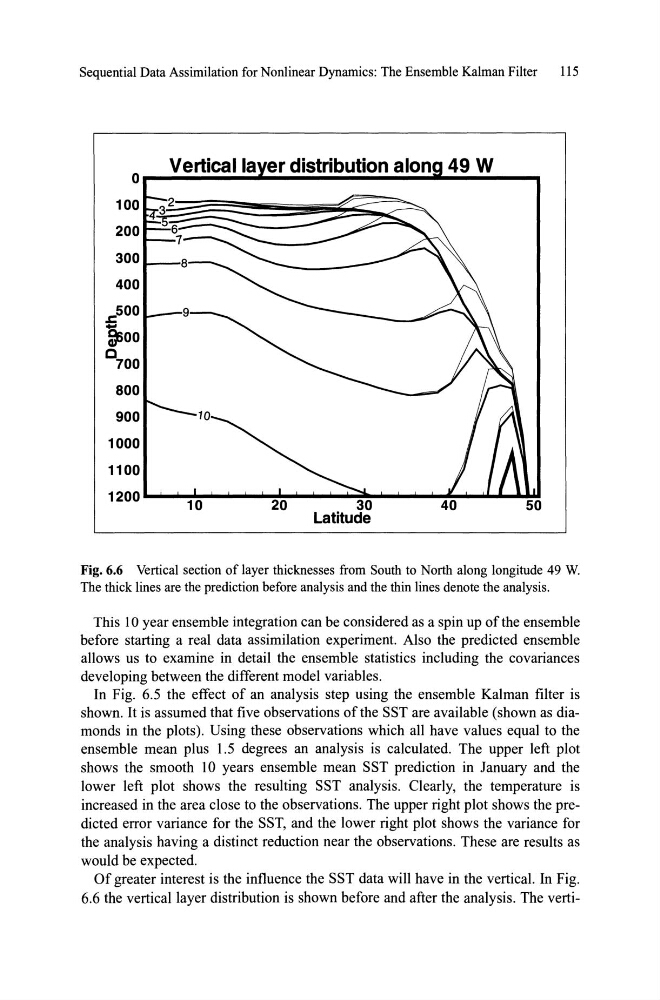
Fig. 6.6 Vertical section of layer thicknesses from South to North along longitude 49 W.
The thick lines are the prediction before analysis and the thin lines denote the analysis.
This 10 year ensemble integration can be considered as a spin up ofthe ensemble
before starting a real data assimilation experiment. Aiso the predicted ensemble
allows us to examine in detail the ensemble statistics including the covariances
developing between the different model variables.
In Fig. 6.5 the effect of an analysis step using the ensemble Kalman filter is
shown. It is assumed that five observations ofthe SST are available (shown as diamonds in the plots). Using these observations which aH have values equal to the
ensemble mean plus 1.5 degrees an analysis is calculated. The upper left plot
shows the smooth 10 years ensemble mean SST prediction in January and the
lower left plot shows the resulting SST analysis. Clearly, the temperature is
increased in the area close to the observations. The upper right plot shows the predicted error variance for the SST, and the lower right plot shows the variance for
the analysis having a distinct reduction near the observations. These are results as
would be expected.
Of greater interest is the inf1uence the SST data will have in the vertical. In Fig.
6.6 the verticallayer distribution is shown before and after the analysis. The verti-
115
o
Vertical la er distribution alon 49W
100
200
300
400
.s:;.soo
... itJoo
°700
800
900
1000
1100
1200
10
Fig. 6.6 Vertical section of layer thicknesses from South to North along longitude 49 W.
The thick lines are the prediction before analysis and the thin lines denote the analysis.
This 10 year ensemble integration can be considered as a spin up ofthe ensemble
before starting a real data assimilation experiment. Aiso the predicted ensemble
allows us to examine in detail the ensemble statistics including the covariances
developing between the different model variables.
In Fig. 6.5 the effect of an analysis step using the ensemble Kalman filter is
shown. It is assumed that five observations ofthe SST are available (shown as diamonds in the plots). Using these observations which aH have values equal to the
ensemble mean plus 1.5 degrees an analysis is calculated. The upper left plot
shows the smooth 10 years ensemble mean SST prediction in January and the
lower left plot shows the resulting SST analysis. Clearly, the temperature is
increased in the area close to the observations. The upper right plot shows the predicted error variance for the SST, and the lower right plot shows the variance for
the analysis having a distinct reduction near the observations. These are results as
would be expected.
Of greater interest is the inf1uence the SST data will have in the vertical. In Fig.
6.6 the verticallayer distribution is shown before and after the analysis. The verti-