

84 Andrew C. Lorenc
( aJ)T
-1 b
T
-1 o
ax = -B (x -x) -H (E + F) (y -H(x))
(30)
If (30) is calculated accurately, they can use more sophisticated and efficient
descent algorithms than the pre-conditioned steepest descent which is used in (29).
The prediction (H) of observed values y from a model state x, can be generalised
from a simple interpolation, as in (14), to a more general prediction using a forecast
model and observation operators, allowing Var to be applied to observations distributed in time, and indirect observations (e.g. satellite radiances).
5.6 Quality Control
5.6.1 Why Quality Control?
The quality control we do in data-assimilation has two reasons:
1) We have physical reasons for believing certain events may occur which affect
the observed value. We wish to detect these events.
2) The distribution of errors associated with a datum is such that there is a nonnegligible probability of errors that would be unacceptably large for the use we
are making of the datum.
o1- obs-l2fit"'L1 fiti
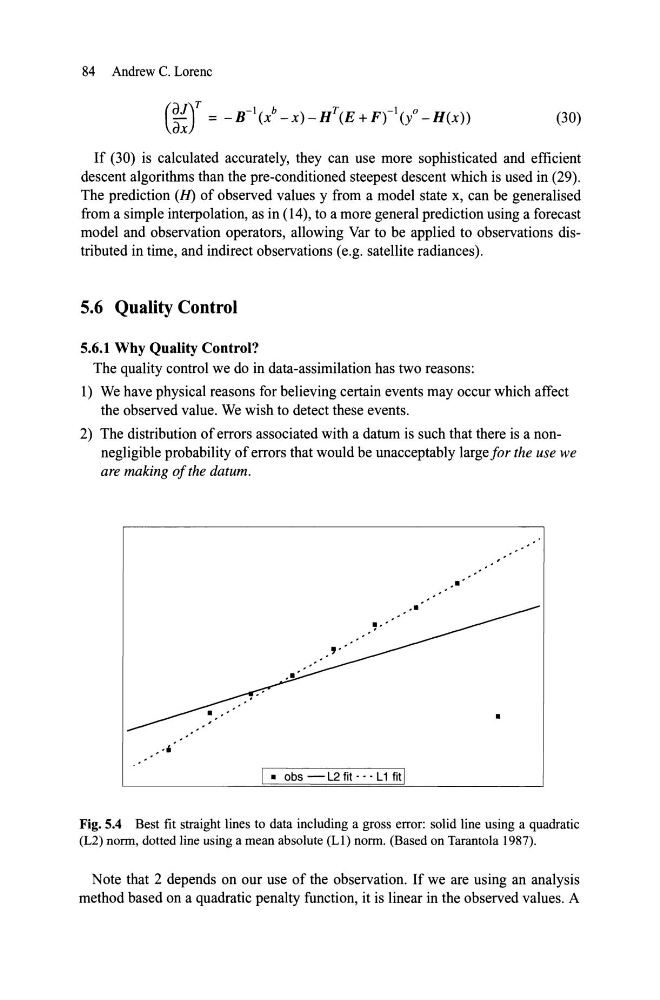
Fig. 5.4 Best fit straight lines to data inciuding a gross error: solid line using a quadratic
(L2) norm, dotted line using a mean absolute (L 1) norm. (Based on Tarantola 1987).
Note that 2 depends on our use of the observation. If we are using an analysis
method based on a quadratic penalty function, it is linear in the observed values. A
( aJ)T
-1 b
T
-1 o
ax = -B (x -x) -H (E + F) (y -H(x))
(30)
If (30) is calculated accurately, they can use more sophisticated and efficient
descent algorithms than the pre-conditioned steepest descent which is used in (29).
The prediction (H) of observed values y from a model state x, can be generalised
from a simple interpolation, as in (14), to a more general prediction using a forecast
model and observation operators, allowing Var to be applied to observations distributed in time, and indirect observations (e.g. satellite radiances).
5.6 Quality Control
5.6.1 Why Quality Control?
The quality control we do in data-assimilation has two reasons:
1) We have physical reasons for believing certain events may occur which affect
the observed value. We wish to detect these events.
2) The distribution of errors associated with a datum is such that there is a nonnegligible probability of errors that would be unacceptably large for the use we
are making of the datum.
o1- obs-l2fit"'L1 fiti
Fig. 5.4 Best fit straight lines to data inciuding a gross error: solid line using a quadratic
(L2) norm, dotted line using a mean absolute (L 1) norm. (Based on Tarantola 1987).
Note that 2 depends on our use of the observation. If we are using an analysis
method based on a quadratic penalty function, it is linear in the observed values. A