

Vertical Structure of the Abyssal Circulation
447
rise to leave through the interface with the thermocline in order to close the
circulation. This means that there must be vortex tube stretching near the
bottom of the abyss and thus a poleward velocity. It is important to note that
this bottom poleward velocity is in response to the perimeter average of the
source input. This bottom poleward flow in the interior would occur
independently of whether the source were placed on the northern, western,
or southern boundary of the basin.
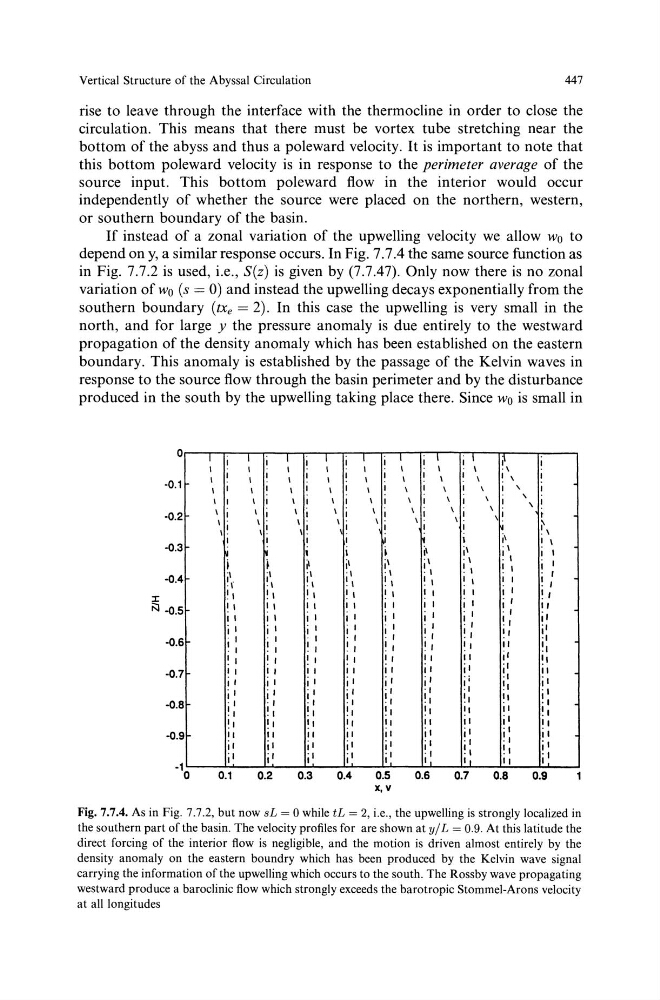
If instead of a zonal variation of the upwelling velocity we allow wo to
depend on y, a similar response occurs. In Fig. 7. 7.4 the same source function as
in Fig. 7.7.2 is used, i.e., S(z) is given by (7.7.47). Only now there is no zonal
variation ofwo (s = 0) and instead the upwelling decays exponentially from the
southern boundary (txe = 2). In this case the upwelling is very small in the
north, and for large y the pressure anomaly is due entirely to the westward
propagation of the density anomaly which has been established on the eastern
boundary. This anomaly is established by the passage of the Kelvin waves in
response to the source flow through the basin perimeter and by the disturbance
produced in the south by the upwelling taking place there. Since w0 is small in
0
-0.1
.0.2
-0.3
.0.4
:r
N ·0.5
-o.s
.0.7
-0.8
-o.9
-1 0
I I
I
I
I
I I
I !
I I
I.
II
!
i
'I
lr
!I
! I
II
j I
. I
! I
! I
II
j I
j I
·I
!I
!I
" il
jl
0.1
I
I
I
I
I
I
I
I I
I I
I .
I!
I
i
'I
!I
!I
II
j I
j I
I
! I
! I
II
j I
jl
·I
!I
!I
" jl
jl
0.2
I
I
I
I
I
I
I
I
I
I
I
I
I
I
i
I
I
I
I I
I I
I
I I
I I
I .
,!
I.
I
I
I
1
I
~
jl
'I
•I
!I
I
! I
I
II
I
j I
I
I I
I
. I
I
! I
I
! I
I
II
I
j I
I
jl
II
·I
·I
!I
!I
!I
!I
II
II
jl
jl
jl
jl
0.3
0.4
I
I
I I
j I
li 1
I
I
I
i
I
. \
I
I
I
I
\
I '
I
i
I
I
I
i
\
I
'
I
I
I i
\
!
\
i
' I
\ i
\
\
'
I I
\ !
\I
t
\ .
\ .
i'
!
!
!
~
. \
I
II
I I
i
~
jl
.,
! I
I I
jl
'I
•I
I
! I
! I
I
·I
I
I
! I
I
! I
I I
! I
! I
I
I I
I I
! I
I I
I
j I
I I
II
i
I
j I
. I
I
!I
. I
I
. I
! I
! I
II
I
! I
I
!I
! I
I
II
II
I
jl
I
jl
I
ii
I
'I
·I
·I
I
!I
!I
!I
II
I
!I
!I
II
I
!I
II
"
i1
I
,,
II
jl
jl
I
il
jl
jl
'I
I
jl
!I
I
jl
jl
I
I
jl
0.5
0.6
0.7
0.8
0.9
x,v
Fig. 7.7.4. As in Fig. 7.7.2, but now sL = 0 while tL = 2, i.e., the upwelling is strongly localized in
the southern part of the basin. The velocity profiles for are shown at y/ L = 0.9. At this latitude the
direct forcing of the interior flow is negligible, and the motion is driven almost entirely by the
density anomaly on the eastern boundry which has been produced by the Kelvin wave signal
carrying the information of the upwelling which occurs to the south. The Ross by wave propagating
westward produce a baroclinic flow which strongly exceeds the barotropic Stommei-Arons velocity
at all longitudes
447
rise to leave through the interface with the thermocline in order to close the
circulation. This means that there must be vortex tube stretching near the
bottom of the abyss and thus a poleward velocity. It is important to note that
this bottom poleward velocity is in response to the perimeter average of the
source input. This bottom poleward flow in the interior would occur
independently of whether the source were placed on the northern, western,
or southern boundary of the basin.
If instead of a zonal variation of the upwelling velocity we allow wo to
depend on y, a similar response occurs. In Fig. 7. 7.4 the same source function as
in Fig. 7.7.2 is used, i.e., S(z) is given by (7.7.47). Only now there is no zonal
variation ofwo (s = 0) and instead the upwelling decays exponentially from the
southern boundary (txe = 2). In this case the upwelling is very small in the
north, and for large y the pressure anomaly is due entirely to the westward
propagation of the density anomaly which has been established on the eastern
boundary. This anomaly is established by the passage of the Kelvin waves in
response to the source flow through the basin perimeter and by the disturbance
produced in the south by the upwelling taking place there. Since w0 is small in
0
-0.1
.0.2
-0.3
.0.4
:r
N ·0.5
-o.s
.0.7
-0.8
-o.9
-1 0
I I
I
I
I
I I
I !
I I
I.
II
!
i
'I
lr
!I
! I
II
j I
. I
! I
! I
II
j I
j I
·I
!I
!I
" il
jl
0.1
I
I
I
I
I
I
I
I I
I I
I .
I!
I
i
'I
!I
!I
II
j I
j I
I
! I
! I
II
j I
jl
·I
!I
!I
" jl
jl
0.2
I
I
I
I
I
I
I
I
I
I
I
I
I
I
i
I
I
I
I I
I I
I
I I
I I
I .
,!
I.
I
I
I
1
I
~
jl
'I
•I
!I
I
! I
I
II
I
j I
I
I I
I
. I
I
! I
I
! I
I
II
I
j I
I
jl
II
·I
·I
!I
!I
!I
!I
II
II
jl
jl
jl
jl
0.3
0.4
I
I
I I
j I
li 1
I
I
I
i
I
. \
I
I
I
I
\
I '
I
i
I
I
I
i
\
I
'
I
I
I i
\
!
\
i
' I
\ i
\
\
'
I I
\ !
\I
t
\ .
\ .
i'
!
!
!
~
. \
I
II
I I
i
~
jl
.,
! I
I I
jl
'I
•I
I
! I
! I
I
·I
I
I
! I
I
! I
I I
! I
! I
I
I I
I I
! I
I I
I
j I
I I
II
i
I
j I
. I
I
!I
. I
I
. I
! I
! I
II
I
! I
I
!I
! I
I
II
II
I
jl
I
jl
I
ii
I
'I
·I
·I
I
!I
!I
!I
II
I
!I
!I
II
I
!I
II
"
i1
I
,,
II
jl
jl
I
il
jl
jl
'I
I
jl
!I
I
jl
jl
I
I
jl
0.5
0.6
0.7
0.8
0.9
x,v
Fig. 7.7.4. As in Fig. 7.7.2, but now sL = 0 while tL = 2, i.e., the upwelling is strongly localized in
the southern part of the basin. The velocity profiles for are shown at y/ L = 0.9. At this latitude the
direct forcing of the interior flow is negligible, and the motion is driven almost entirely by the
density anomaly on the eastern boundry which has been produced by the Kelvin wave signal
carrying the information of the upwelling which occurs to the south. The Ross by wave propagating
westward produce a baroclinic flow which strongly exceeds the barotropic Stommei-Arons velocity
at all longitudes