

446
Abyssal Circulation
velocity so that the barotropic meridional velocity calculated from StommelArons theory is seen to be a small residual which remains after vertical
averaging.
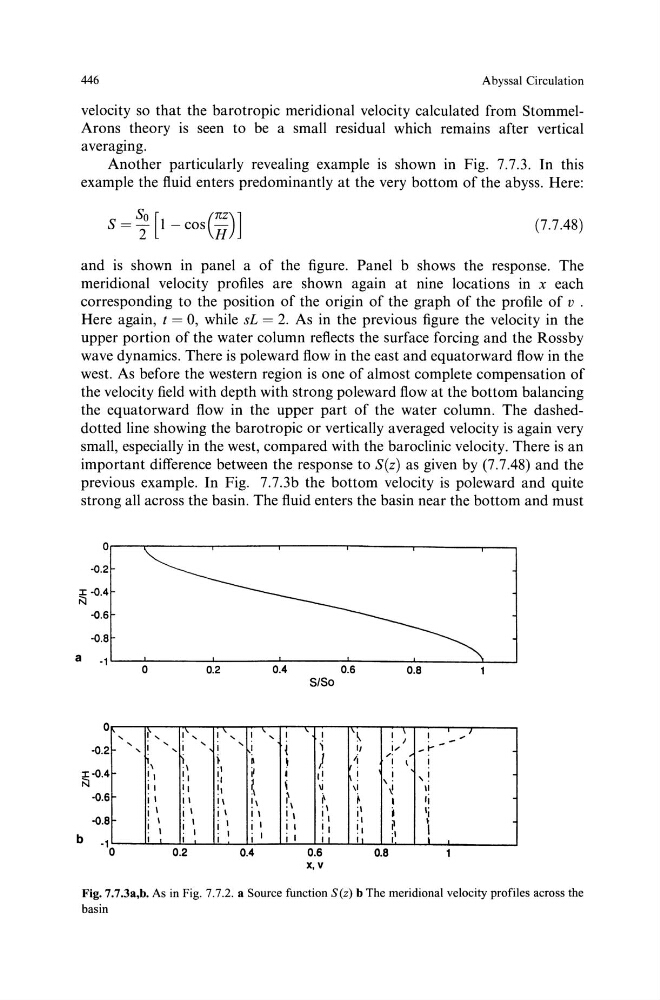
Another particularly revealing example is shown in Fig. 7.7.3. In this
example the fluid enters predominantly at the very bottom of the abyss. Here:
(7.7.48)
and is shown in panel a of the figure. Panel b shows the response. The
meridional velocity profiles are shown again at nine locations in x each
corresponding to the position of the origin of the graph of the profile of v .
Here again, t = 0, while sL = 2. As in the previous figure the velocity in the
upper portion of the water column reflects the surface forcing and the Ross by
wave dynamics. There is poleward flow in the east and equatorward flow in the
west. As before the western region is one of almost complete compensation of
the velocity field with depth with strong poleward flow at the bottom balancing
the equatorward flow in the upper part of the water column. The dasheddotted line showing the barotropic or vertically averaged velocity is again very
small, especially in the west, compared with the baroclinic velocity. There is an
important difference between the response to S(z) as given by (7.7.48) and the
previous example. In Fig. 7.7.3b the bottom velocity is poleward and quite
strong all across the basin. The fluid enters the basin near the bottom and must
0
-0.2
~ -o.4
a
-o.6
-0.8
-1
0
-o.2
i!j-o.4
·0.6
-o.8
b
' '
0
! '
' !
·\
!I
II
j I
j I
I
I I
I
0.2
I ' ! ' '
'
'
, I
I
·I
!I
• "I
!I
!I
!I
II
II
j I
j I
I
I
I
I
I
i
I
I
0.2
0.4
0.6
0.8
S/So
I ' ' !
' I
~
I
I
~
'
i
• J
~i--~ -
I
{
I/
1...~
!
)
~
. . . . i ( I
~
I
I!
I
I
' I
I,
i
,.
~
\I
~
II
!I
~
~
~
I
lj
.\
•I
jl
j
r
I I
! I
II
I
·I
~
I
I I
II
! I
II
I
i I
j I
jl
I
I
I
0.4
0.6
0.8
X,V
Fig. 7.7.3a,b. As in Fig. 7.7.2. a Source function S(z) b The meridional velocity profiles across the
basin
Abyssal Circulation
velocity so that the barotropic meridional velocity calculated from StommelArons theory is seen to be a small residual which remains after vertical
averaging.
Another particularly revealing example is shown in Fig. 7.7.3. In this
example the fluid enters predominantly at the very bottom of the abyss. Here:
(7.7.48)
and is shown in panel a of the figure. Panel b shows the response. The
meridional velocity profiles are shown again at nine locations in x each
corresponding to the position of the origin of the graph of the profile of v .
Here again, t = 0, while sL = 2. As in the previous figure the velocity in the
upper portion of the water column reflects the surface forcing and the Ross by
wave dynamics. There is poleward flow in the east and equatorward flow in the
west. As before the western region is one of almost complete compensation of
the velocity field with depth with strong poleward flow at the bottom balancing
the equatorward flow in the upper part of the water column. The dasheddotted line showing the barotropic or vertically averaged velocity is again very
small, especially in the west, compared with the baroclinic velocity. There is an
important difference between the response to S(z) as given by (7.7.48) and the
previous example. In Fig. 7.7.3b the bottom velocity is poleward and quite
strong all across the basin. The fluid enters the basin near the bottom and must
0
-0.2
~ -o.4
a
-o.6
-0.8
-1
0
-o.2
i!j-o.4
·0.6
-o.8
b
' '
0
! '
' !
·\
!I
II
j I
j I
I
I I
I
0.2
I ' ! ' '
'
'
, I
I
·I
!I
• "I
!I
!I
!I
II
II
j I
j I
I
I
I
I
I
i
I
I
0.2
0.4
0.6
0.8
S/So
I ' ' !
' I
~
I
I
~
'
i
• J
~i--~ -
I
{
I/
1...~
!
)
~
. . . . i ( I
~
I
I!
I
I
' I
I,
i
,.
~
\I
~
II
!I
~
~
~
I
lj
.\
•I
jl
j
r
I I
! I
II
I
·I
~
I
I I
II
! I
II
I
i I
j I
jl
I
I
I
0.4
0.6
0.8
X,V
Fig. 7.7.3a,b. As in Fig. 7.7.2. a Source function S(z) b The meridional velocity profiles across the
basin