

Nonadiahatic Equations in Characteristic Form
305
which is the starting point of the integration of the characteristic system
(5.3.15). West of the curve Call the characteristics emanate from the western
boundary, as shown with the curve A which is also coincident with a streamline
in layer 2 in the region north of the outcrop line.
When a characteristic crosses the outcrop line, the continuation of the
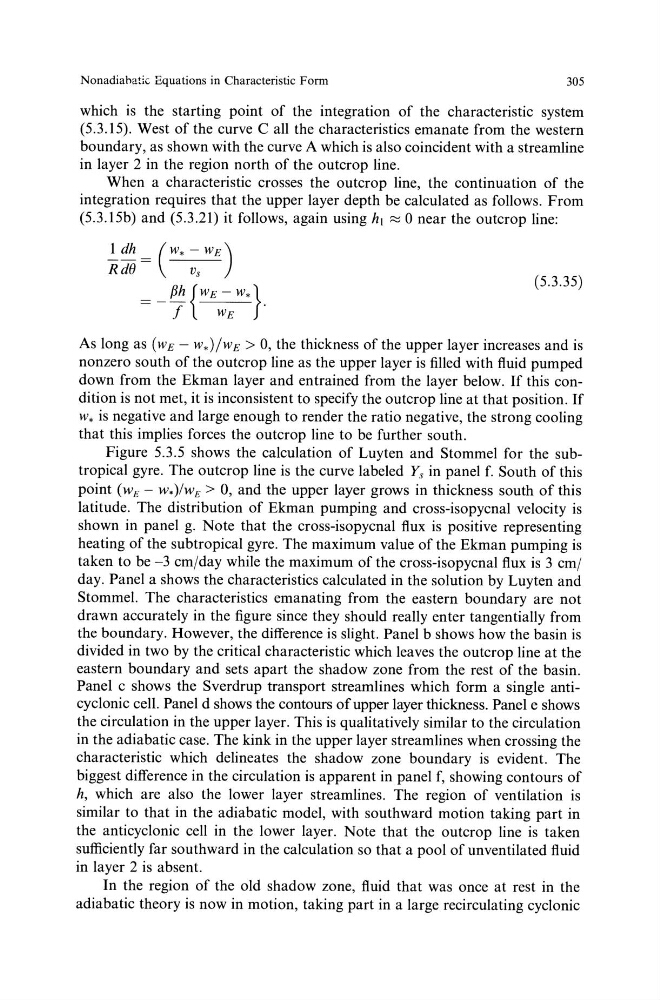
integration requires that the upper layer depth be calculated as follows. From
(5.3.15b) and (5.3.21) it follows, again using h1 ~ 0 near the outcrop line:
( 5.3.35)
As long as (wE- w.)/wE > 0, the thickness of the upper layer increases and is
nonzero south of the outcrop line as the upper layer is filled with fluid pumped
down from the Ekman layer and entrained from the layer below. If this condition is not met, it is inconsistent to specify the outcrop line at that position. If
w. is negative and large enough to render the ratio negative, the strong cooling
that this implies forces the outcrop line to be further south.
Figure 5.3.5 shows the calculation of Luyten and Stommel for the subtropical gyre. The outcrop line is the curve labeled Ys in panel f. South of this
point (wE- w.)lwE > 0, and the upper layer grows in thickness south of this
latitude. The distribution of Ekman pumping and cross-isopycnal velocity is
shown in panel g. Note that the cross-isopycnal flux is positive representing
heating of the subtropical gyre. The maximum value of the Ekman pumping is
taken to be -3 em/day while the maximum of the cross-isopycnal flux is 3 em/
day. Panel a shows the characteristics calculated in the solution by Luyten and
Stommel. The characteristics emanating from the eastern boundary are not
drawn accurately in the figure since they should really enter tangentially from
the boundary. However, the difference is slight. Panel b shows how the basin is
divided in two by the critical characteristic which leaves the outcrop line at the
eastern boundary and sets apart the shadow zone from the rest of the basin.
Panel c shows the Sverdrup transport streamlines which form a single anticyclonic cell. Panel d shows the contours of upper layer thickness. Panel e shows
the circulation in the upper layer. This is qualitatively similar to the circulation
in the adiabatic case. The kink in the upper layer streamlines when crossing the
characteristic which delineates the shadow zone boundary is evident. The
biggest difference in the circulation is apparent in panel f, showing contours of
h, which are also the lower layer streamlines. The region of ventilation is
similar to that in the adiabatic model, with southward motion taking part in
the anticyclonic cell in the lower layer. Note that the outcrop line is taken
sufficiently far southward in the calculation so that a pool of unventilated fluid
in layer 2 is absent.
In the region of the old shadow zone, fluid that was once at rest in the
adiabatic theory is now in motion, taking part in a large recirculating cyclonic
305
which is the starting point of the integration of the characteristic system
(5.3.15). West of the curve Call the characteristics emanate from the western
boundary, as shown with the curve A which is also coincident with a streamline
in layer 2 in the region north of the outcrop line.
When a characteristic crosses the outcrop line, the continuation of the
integration requires that the upper layer depth be calculated as follows. From
(5.3.15b) and (5.3.21) it follows, again using h1 ~ 0 near the outcrop line:
( 5.3.35)
As long as (wE- w.)/wE > 0, the thickness of the upper layer increases and is
nonzero south of the outcrop line as the upper layer is filled with fluid pumped
down from the Ekman layer and entrained from the layer below. If this condition is not met, it is inconsistent to specify the outcrop line at that position. If
w. is negative and large enough to render the ratio negative, the strong cooling
that this implies forces the outcrop line to be further south.
Figure 5.3.5 shows the calculation of Luyten and Stommel for the subtropical gyre. The outcrop line is the curve labeled Ys in panel f. South of this
point (wE- w.)lwE > 0, and the upper layer grows in thickness south of this
latitude. The distribution of Ekman pumping and cross-isopycnal velocity is
shown in panel g. Note that the cross-isopycnal flux is positive representing
heating of the subtropical gyre. The maximum value of the Ekman pumping is
taken to be -3 em/day while the maximum of the cross-isopycnal flux is 3 em/
day. Panel a shows the characteristics calculated in the solution by Luyten and
Stommel. The characteristics emanating from the eastern boundary are not
drawn accurately in the figure since they should really enter tangentially from
the boundary. However, the difference is slight. Panel b shows how the basin is
divided in two by the critical characteristic which leaves the outcrop line at the
eastern boundary and sets apart the shadow zone from the rest of the basin.
Panel c shows the Sverdrup transport streamlines which form a single anticyclonic cell. Panel d shows the contours of upper layer thickness. Panel e shows
the circulation in the upper layer. This is qualitatively similar to the circulation
in the adiabatic case. The kink in the upper layer streamlines when crossing the
characteristic which delineates the shadow zone boundary is evident. The
biggest difference in the circulation is apparent in panel f, showing contours of
h, which are also the lower layer streamlines. The region of ventilation is
similar to that in the adiabatic model, with southward motion taking part in
the anticyclonic cell in the lower layer. Note that the outcrop line is taken
sufficiently far southward in the calculation so that a pool of unventilated fluid
in layer 2 is absent.
In the region of the old shadow zone, fluid that was once at rest in the
adiabatic theory is now in motion, taking part in a large recirculating cyclonic